Music Career Data-Driven Decisions for Indie Artists

Using streaming, audience, and engagement data lets independent artists make fast, low-cost choices that improve reach, revenue, and tour outcomes. You don’t need a label or a data team to do this. You need the right numbers, a clear process, and the discipline to act on what you find.
The three things to check right now:
- Streaming metrics: Open Spotify for Artists and find your top three countries by monthly listeners. That’s your first tour-market shortlist.
- Audience engagement: Check your save rate and completion rate on your last release. Low saves usually mean the hook isn’t landing; low completion points to a weak intro or drop.
- Social signals: Pull your last 10 posts on TikTok or Instagram. Which format drove the most profile visits or link clicks? That’s your content direction for the next 30 days.
Your next step (30–60 minutes): Link your Spotify for Artists account, pull the “Audience” tab, and export your top five cities and countries. Screenshot it. That single report will inform your next release push, your first ad test, and your touring shortlist.
Pro Tip: Don’t wait until your next release to start pulling data. Run this audit on your existing catalog today. Your back catalog is already telling you where your fans live.
Table of Contents
- Which KPIs actually matter for your music career?
- Where do you actually get this data?
- Five decisions data can make easier right now
- A simple 5-step data workflow you can run every week
- How long does this take and what does it cost?
- Common mistakes that will send you in the wrong direction
- How Upncomer maps to this workflow
- What you owe your fans: privacy and ethics in fan data
- Artists who got this right
- Trends versus spikes: how to tell the difference
- Key Takeaways
- Data supports your creativity; it doesn’t replace it
- Upncomer brings this whole workflow into one place
- Useful sources for deeper research
- FAQ
Which KPIs actually matter for your music career?
Streaming counts feel good, but they rarely tell you what to do next. The metrics that drive real music career data-driven decisions are the ones that reveal why something is or isn’t working.
- Monthly listeners vs. streams: Listeners tell you reach; streams tell you loyalty. A high listener count with low streams per listener means people are sampling but not coming back.
- Save rate: Saves are the strongest intent signal on Spotify. A track with a high save rate is worth pitching to playlist curators, even if total streams are modest.
- Completion rate and skip rate: Skip rate and listener retention are the metrics practitioners use to decide whether to scale promotion or pull back. If listeners are dropping before the chorus, the production or arrangement needs attention before you spend on ads.
- Playlist adds and drops: A sudden drop from a major playlist explains a stream dip better than any other signal. Track this weekly.
- Follower growth rate: Absolute follower count matters less than the rate. A spike in followers after a specific post or placement tells you what’s actually converting casual listeners into fans.
- Engagement rate on social posts: Likes are vanity. Comments, shares, and saves on Instagram or TikTok are the signals worth optimizing for.
- Shazams: A rising Shazam count in a city you haven’t promoted in is one of the clearest organic demand signals you’ll find.
- Ticket and merch conversion: If 10,000 people stream you in Chicago but only 40 bought a ticket there, something in the funnel is broken. That gap is your next problem to solve.
Pro Tip: High saves plus low completion is a specific pattern worth acting on. It means people like the idea of the song enough to save it but aren’t finishing it. Try re-editing the intro or the first 30 seconds before your next push.
Where do you actually get this data?
Every major platform gives you free analytics. The question is whether you pull them one by one or centralize them.
| Source | What it gives you | Best for | Limitation |
|---|---|---|---|
| Spotify for Artists | Streams, listeners, saves, playlist adds, top cities/countries | Release decisions, playlist pitching, tour markets | Spotify only |
| Apple Music for Artists | Plays, listeners, Shazams, city-level data | Cross-checking Spotify signals, Shazam trends | Apple ecosystem only |
| YouTube Analytics | Watch time, audience retention, traffic sources, demographics | Video content strategy, ad targeting | Video-first; audio streams separate |
| TikTok Analytics | Video views, profile visits, follower growth, audience age/location | Content format testing, viral signal detection | Short-form only |
| Instagram Insights | Reach, saves, shares, link clicks, story exits | Fan engagement quality, content direction | No streaming data |
| Ticketing dashboards (e.g., Eventbrite, Bandsintown) | Ticket sales by city, purchase timing, repeat buyers | Tour routing, presale strategy | Requires existing show history |
| Merch platforms (e.g., Shopify, Bandcamp) | Sales by product, geography, purchase timing | Merch pricing, bundle testing | Siloed from streaming data |
Platform-native dashboards are the most accurate source for their own data. The trade-off is that you’re looking at five or six separate tabs to get a full picture. Cross-platform analytics tools let you compare performance across Spotify, TikTok, YouTube, radio airplay, and social channels in one view, which is where you start spotting geographic growth before it becomes obvious.
For most indie artists starting out, the free dashboards are enough for the first three to six months. Connect Spotify for Artists and YouTube Analytics first. Those two cover the majority of your streaming and video signals and take under an hour to set up. Check out the music marketing tools guide for a fuller breakdown of what to layer in next.
Five decisions data can make easier right now
1. Release timing and priority tracks
Pull your streaming data by day of week and time of day. Most artists see higher engagement on Friday releases (aligned with New Music Friday playlists), but your specific audience might peak on Thursday evenings. Let the data confirm or challenge the default.

For priority tracks, look at your catalog’s save rate and playlist add history. The track with the highest save rate relative to its stream count is your best pitch candidate, not necessarily your most-streamed song.
2. Where to tour or book shows
Combining ticketing, streaming, and playlist data to build market-level heatmaps is how smart managers route tours. Prioritize cities where streaming growth, playlist activity, and merch purchase rates all point in the same direction. One strong signal is interesting; three converging signals is a booking decision. Ticketing data combined with streaming growth can even forecast sellouts 30 days early, giving you time to add a second show or upgrade the venue.

3. Where to target ads and organic promotion
Your top streaming cities are your first ad-targeting list. If Atlanta is your third-biggest market by listeners but you’ve never run a single ad there, that’s money left on the table. Start with a small spend ($5–$10/day for two weeks) in your top three cities before expanding. For genre-specific targeting, understanding how music intersects with local culture, like how Latin music connects to dance communities, can sharpen your creative and targeting choices considerably.
4. Which songs to pitch to playlists and curators
Playlist pitching works best when you have data behind the ask. Lead with your save rate, completion rate, and any organic playlist adds the track already has. Curators respond to evidence of listener behavior, not just your enthusiasm.
5. Merch and pricing decisions
Look at which cities buy merch most often relative to their stream count. A city with high streams and low merch sales might respond to a bundle offer or a lower price point. A city with high merch conversion is worth a pop-up or a local retail partnership.
A simple 5-step data workflow you can run every week
You don’t need to be an analyst to run this. You need 60–90 minutes a week and a consistent process.
- Collect: Pull data from Spotify for Artists, YouTube Analytics, and your top social platform. Export or screenshot your key numbers: listeners, streams, saves, top cities, engagement rate, and follower change.
- Centralize: Drop everything into a single spreadsheet or a tool like Upncomer’s Data Analyst module. One row per week, one column per metric. Consistency here is what makes trends visible.
- Analyze: Compare this week to last week and to four weeks ago. Look for direction, not just size. Is your save rate trending up? Are listeners in a new city growing week over week?
- Test: Pick one variable to test per two-week window. A different posting time, a new ad creative, a different song in your pre-save campaign. Keep everything else constant so you can read the result clearly. A/B testing with short promotion windows gives you cleaner signals faster than running long, unfocused campaigns.
- Iterate: After two weeks, read the result and make one decision. Scale what worked, drop what didn’t, and set up the next test. This is the whole loop.
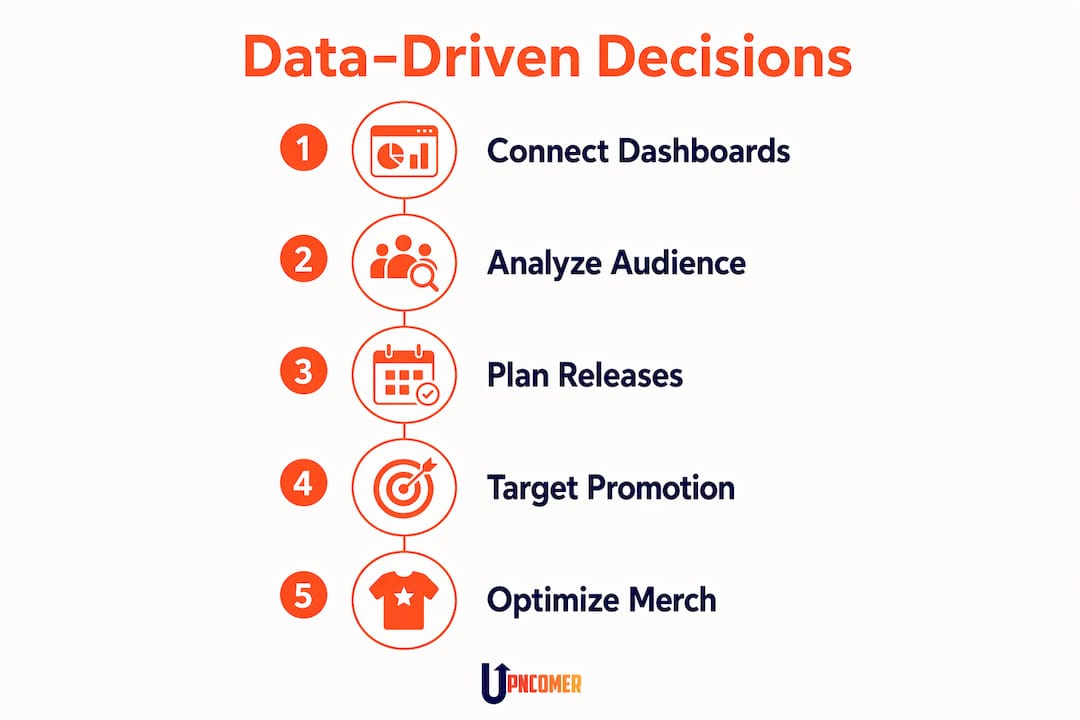
Weeks 1–2: Connect dashboards, pull baseline data, identify your top three markets and your best-performing track by save rate. Weeks 3–4: Run your first small ad test in your top city. Track streams, saves, and follower growth daily. Weeks 5–6: Analyze ad results. Pitch your highest save-rate track to three playlist curators using your data as supporting evidence. Weeks 7–8: Review all metrics against your week-1 baseline. Identify the one decision that moved the needle most and double down on it.
For a full release-day checklist that maps to this workflow, the music release checklist for independent artists covers every step in sequence.
How long does this take and what does it cost?
Realistic expectations matter here. Data doesn’t produce overnight results, but it does produce faster results than guessing.
| Phase | Timeline | What you’re looking for |
|---|---|---|
| Early signals | Weeks 1–4 | Save rate trends, top market confirmation, first ad signal |
| Measurable campaign impact | Weeks 4–8 | Listener growth in targeted cities, playlist add uptick |
| Career-level inflection | Months 3–6 | Sustained audience growth, tour demand, merch conversion lift |
Typical tool costs for indie artists:
| Tool type | Monthly cost range | What you get |
|---|---|---|
| Free platform dashboards | Free | Spotify for Artists, Apple Music for Artists, YouTube Analytics, TikTok/Instagram |
| Low-cost aggregator subscriptions | $10–$30/month | Cross-platform views, basic alerts, trend tracking |
| Premium analytics platforms | — | Airplay tracking, radio data, deep audience segmentation |
| Ad spend for market testing | — | Enough to test two to three cities with meaningful data |
Streaming accounts for the majority of global music revenue, which is why streaming analytics should be the first place you invest attention, even before ad spend. The free dashboards give you most of what you need in the first six months. Spend money on ads before you spend it on premium analytics tools. The ad data will tell you more, faster.
Industry-grade data from providers like Luminate, which aggregates from hundreds of streaming, retail, and airplay sources, is more relevant for managers and labels tracking market share. Most indie artists don’t need it until they’re managing multiple releases across multiple markets simultaneously.
Common mistakes that will send you in the wrong direction
Data is only useful if you’re reading it correctly. These are the traps that catch most artists early.
- Reacting to a single-week spike: One viral moment on TikTok can inflate your listener count for two to three weeks and then vanish. Cross-check metrics across at least two platforms and over multiple weeks before reallocating budget based on a spike.
- Optimizing for streams instead of saves: Streams can be inflated by playlist placement or a single viral moment. Saves reflect genuine intent and are harder to fake.
- Ignoring skip rate: A track with 500,000 streams but a 60% skip rate in the first 30 seconds is not a hit. It’s a track with a bad intro that happened to get placed somewhere.
- Bot-driven follower spikes: A sudden jump in followers with no corresponding increase in engagement or streams is a red flag. Real fan growth shows up across multiple metrics simultaneously.
- Treating all markets equally: Your top streaming country is not automatically your best touring market. Cross-reference streaming data with ticket sales history and merch conversion before booking.
Validation checklist before acting on any signal:
- Does the same trend appear on at least two platforms?
- Has the trend held for at least two consecutive weeks?
- Is engagement (saves, comments, shares) moving in the same direction as reach?
- Can you rule out an external event (a playlist add, a press mention) that explains the spike?
How Upncomer maps to this workflow
Running this process manually across five dashboards is doable, but it’s slow. Upncomer is built to compress that friction for independent artists who want the output without the overhead.
Here’s how the platform maps to the five workflow steps:
- Collect: Upncomer’s Growth Engine pulls streaming and social signals into one place, so you’re not toggling between tabs.
- Centralize: The Data Analyst module organizes your metrics into a consistent format week over week, making trend-spotting straightforward.
- Analyze: Amplitude AI surfaces the patterns that matter, like a rising save rate in a new city, and flags them before you’d catch them manually.
- Test: The Content Creator and Artist Manager modules help you set up and track A/B tests on content and campaigns without needing a separate project management tool.
- Iterate: Distribution and Publicist modules let you act on what you find, whether that’s pushing a track to new markets or pitching to curators with data-backed context.
A formal data strategy covering collection, cleaning, and visualization gives independent artists advantages similar to major-label acts. Upncomer is designed to make that process accessible without requiring analyst skills or a full team.
Pro Tip: Start with the Growth Engine report on your existing catalog before your next release. It will show you which tracks have the most untapped audience potential, so you know where to focus promotion first.
For a deeper look at how managers use analytics platforms to make development decisions, the music managers analytics guide is worth reading alongside this workflow.
What you owe your fans: privacy and ethics in fan data
Collecting fan data comes with real responsibilities. Most artists don’t think about this until something goes wrong.
When you collect email addresses, purchase data, or location information through your website, merch store, or mailing list, you’re subject to U.S. privacy norms and, depending on where your fans live, regulations like the EU’s GDPR or California’s CCPA. The practical baseline: only collect what you actually use, tell fans what you’re collecting and why, and never sell or share their data without explicit consent.
Platform analytics (Spotify, TikTok, YouTube) are aggregated and anonymized by the platforms themselves. You’re seeing trends, not individual profiles. That’s a meaningful distinction. Where it gets more personal is email marketing and direct fan engagement tools, where you’re handling real contact information.
Be transparent in your email sign-up copy. Use a reputable email platform (Mailchimp, ConvertKit, or similar) that handles unsubscribe compliance automatically. And if you’re running retargeting ads, use platform-level audience tools rather than building custom lists from scraped data.
This article is general information, not legal advice. If you’re building a significant fan database or running paid campaigns that involve personal data, confirm your obligations with a qualified privacy professional for your specific situation.
Artists who got this right
The clearest examples of data-driven music career decisions come from artists who used platform signals to make moves their gut alone wouldn’t have justified.
Chance the Rapper’s team famously used streaming and social data to identify cities where his fanbase was growing organically before booking tours there. The result was sold-out shows in markets where he had no radio presence. The data told the story the traditional industry metrics missed.
On the indie side, artists using Spotify for Artists’ audience data to identify unexpected geographic pockets, like a country artist finding a strong listener base in Brazil, have used that signal to license music locally, pitch regional playlists, and connect with local promoters. None of that happens without checking the “Audience” tab.
The pattern across these examples is consistent: the data doesn’t replace the decision. It removes the guesswork from which decision to make first. Independent artists who implement a formal data strategy can achieve competitive advantages similar to major labels by identifying breakout tracks and audience pockets early.
Trends versus spikes: how to tell the difference
A spike is a single event. A trend is a direction. Confusing the two is how artists waste budget.
A spike looks like this: your streams jump 300% in one week, then fall back to baseline the following week. It usually traces back to a playlist add, a viral TikTok, or a press mention. It’s worth noting, but it’s not a strategy signal.
A trend looks like this: your monthly listeners in Austin have grown 15–20% for four consecutive weeks, your save rate there is above your catalog average, and you’ve had three organic playlist adds from Texas-based curators. That’s a pattern worth acting on.
The rule of thumb: require at least three data points over three separate time periods before calling something a trend. One week is noise. Two weeks is interesting. Three weeks in the same direction is a signal worth spending on.
Automated alerts can help here. Setting threshold-based notifications for follower spikes, playlist adds, or rank changes means you catch momentum early without staring at dashboards daily. The key is requiring cross-platform confirmation before treating any alert as a green light to act.
Key Takeaways
Independent artists who track the right metrics, run a consistent weekly workflow, and validate signals before acting will outpace artists relying on gut feel alone, regardless of budget.
| Point | Details |
|---|---|
| Start with free dashboards | Spotify for Artists and YouTube Analytics cover most signals you need for the first six months at zero cost. |
| Save rate beats stream count | A high save rate signals genuine listener intent and is your strongest argument when pitching to playlist curators. |
| Validate before spending | Require three weeks of consistent data across two platforms before reallocating ad budget based on any signal. |
| Tour where data converges | Book shows in cities where streaming growth, playlist adds, and merch conversion all point in the same direction. |
| Upncomer centralizes the workflow | Upncomer’s Growth Engine, Amplitude AI, and Data Analyst modules compress the collect-analyze-act cycle into one platform. |
Data supports your creativity; it doesn’t replace it
Here’s what I think gets lost in conversations about analytics: data is not the opposite of artistic instinct. It’s the thing that tells you where to point your instinct.
The artists who use data well aren’t the ones who let a save rate decide what song to write next. They’re the ones who use a save rate to decide which song to push hardest, which city to play first, and which ad creative to run longer. The creative decision happened in the studio. The data decision happens in the campaign.
What concerns me is the artist who dismisses analytics entirely because it feels corporate, and the one who becomes so metric-obsessed that every creative choice gets filtered through a dashboard. Both miss the point. The goal is to reduce the cost of being wrong, not to eliminate risk. You still have to make the bet. Data just helps you make it in the right market, at the right time, with the right song leading.
Use the numbers to protect your creative energy. Spend less time wondering if something is working and more time making the next thing.
Upncomer brings this whole workflow into one place
Most indie artists are running their data workflow across five browser tabs, a spreadsheet, and a gut feeling. Upncomer replaces that with a single platform built specifically for independent artists and music teams.
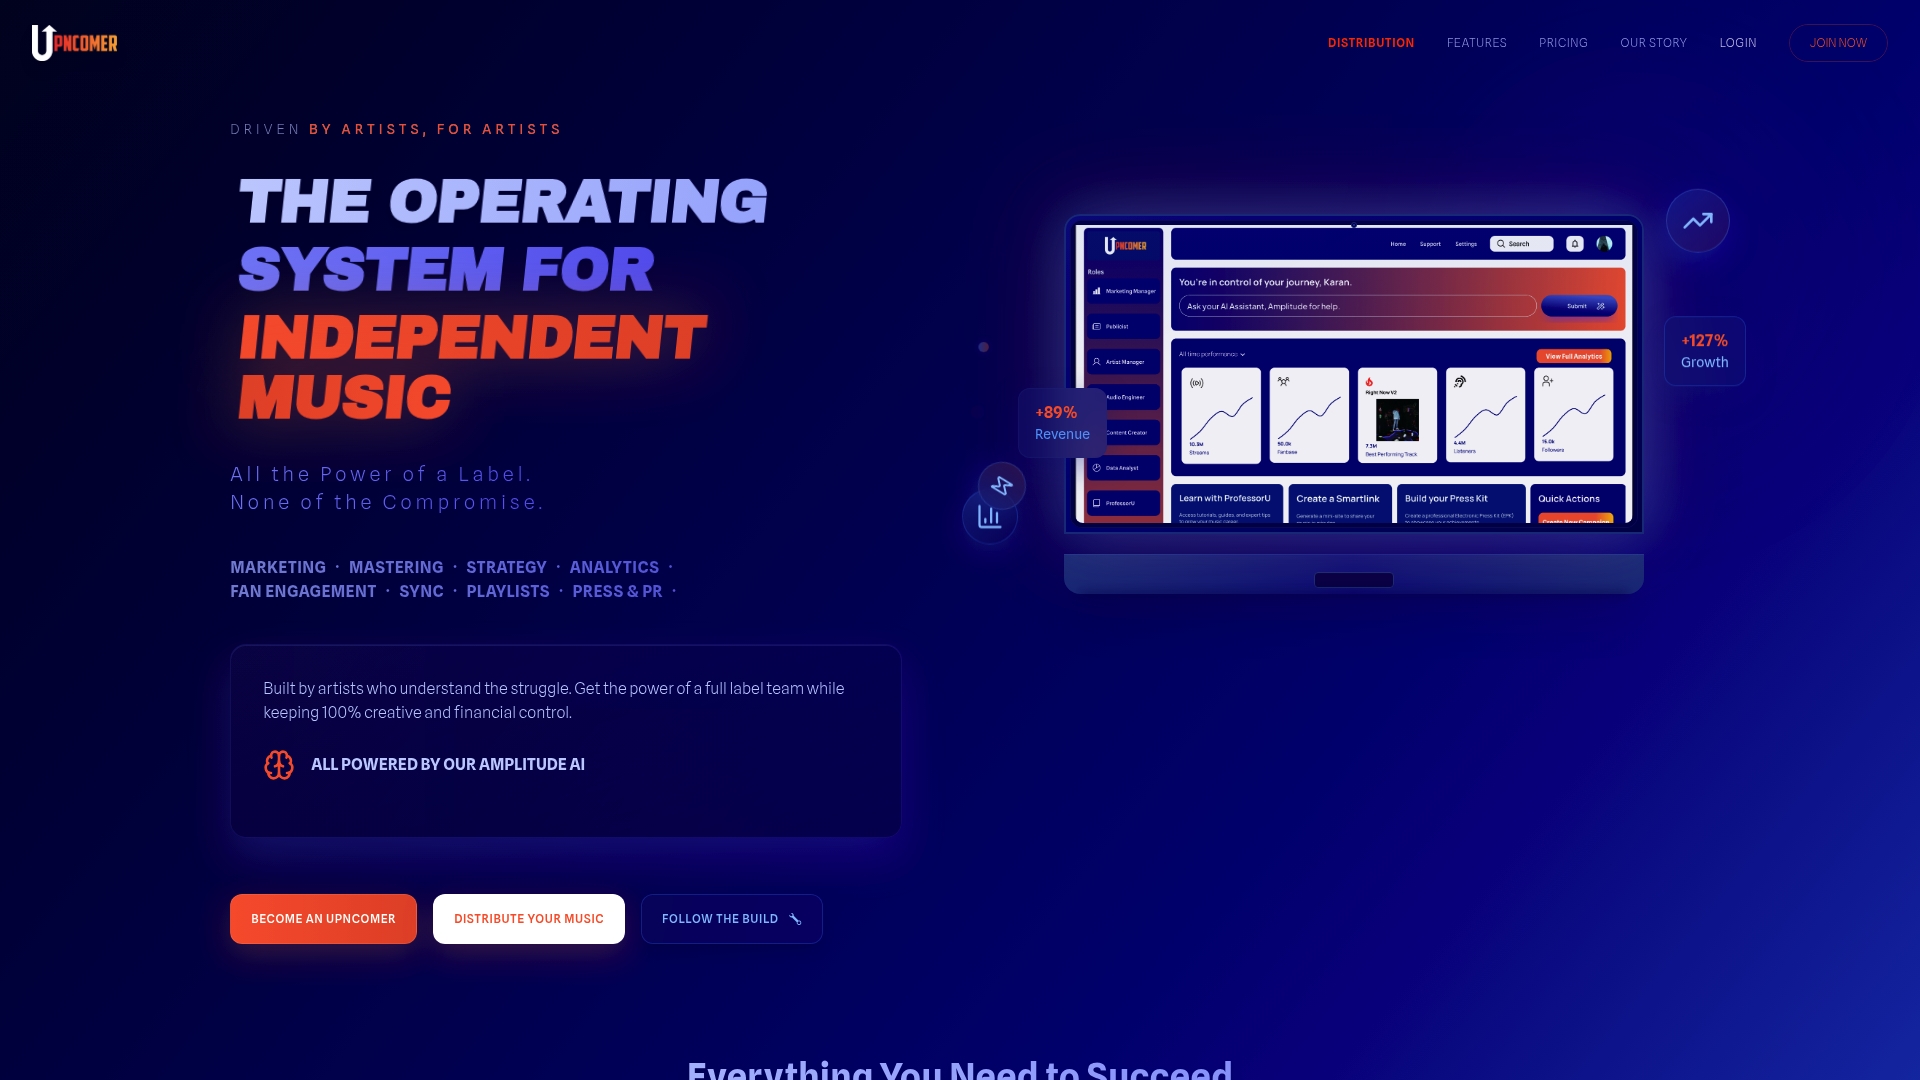
The Growth Engine analyzes your existing catalog and surfaces which tracks have untapped audience potential. Amplitude AI flags momentum signals before you’d catch them manually. The Data Analyst module keeps your weekly metrics organized so trends become visible without hours of manual work. And when you’re ready to act, Distribution, Publicist, and Content Creator modules let you move from insight to campaign without switching tools.
By week four of using the platform, most artists have a clear picture of their top markets, their strongest tracks, and their next campaign priority. That’s the kind of clarity that used to require a label team. Explore what Upncomer can do for your career at upncomer.co.
Useful sources for deeper research
- NYU Steinhardt: Data Analysis in the Music Industry — Academic course covering data sources, analytic methods, and business applications in the music industry.
- Berklee Online: Data Analytics in the Music Business — Practical course on building a formal data strategy for independent artists and music professionals.
- IFPI Global Music Report — Annual industry report covering global revenue, streaming trends, and market-by-market consumption data.
- Luminate Music Data — Industry-grade data aggregator covering streaming, airplay, and retail across hundreds of sources; used by labels and managers for market analysis.
- Spotify for Artists Help Center — Official documentation on reading your dashboard, understanding metrics, and submitting tracks for playlist consideration.
- YouTube Analytics Help — Platform documentation covering audience retention, traffic sources, and revenue reporting for music creators.
- Orion Promotion: Data-Driven Decisions for Musicians — Practitioner-focused guide on applying streaming and ticketing data to real career decisions.
FAQ
What are examples of data-driven decisions in music?
Booking a tour in cities where streaming growth and merch conversion both trend upward, pitching a track to curators based on its save rate rather than total streams, and targeting ads to your top three listener markets are all concrete examples of music career data-driven decisions.
Will AI replace musicians?
No. AI tools in music handle pattern recognition, data analysis, and workflow automation, but creative decisions, performance, and artistic identity remain human. Platforms like Upncomer use AI to surface insights and reduce manual work, not to write songs or replace artists.
What are the major players in the U.S. music industry?
The U.S. music industry is dominated by three major label groups (Universal Music Group, Sony Music Entertainment, and Warner Music Group), alongside a growing independent sector supported by distributors, streaming platforms, and artist-services companies.
How do I know if a streaming spike is real growth or just noise?
Require the same upward trend across at least two platforms over three consecutive weeks before acting on it. A single-week spike that doesn’t show up in saves, follower growth, or engagement is almost always a one-time event, not a trend worth spending on.