Why Music Managers Use Analytics Platforms in 2026

Music analytics platforms are defined as software tools that consolidate streaming, social media, playlist, and audience data into unified dashboards that replace gut-based decisions with measurable performance signals. This is exactly why music managers use analytics platforms: they turn fragmented numbers from Spotify, TikTok, YouTube, and radio into a single, comparable view of an artist’s momentum. Tools like Chartmetric, Viberate, and Spotify for Artists each serve a piece of this puzzle, but the real power comes from combining them. When you can see cause and effect across every channel at once, you stop guessing and start managing.
Why music managers use analytics platforms for roster management
Managing a roster without consistent data is like coaching a sports team without a scoreboard. You might have a feel for who is performing, but you cannot prove it, budget around it, or defend it in a contract negotiation.
Consistent benchmarking across channels solves this directly. Weekly or monthly performance reports give you a running record of each artist’s streaming growth, social engagement, playlist placements, and audience demographics. That record prevents you from making strategic shifts based on one-off spikes or inaccurate memories. It also gives you something concrete to bring into label meetings or sponsorship conversations.
Here is what a well-structured roster monitoring workflow actually tracks:
- Streaming velocity: Are monthly listeners growing week over week, or plateauing after a release?
- Playlist placements: Which editorial or algorithmic playlists are driving the most new listeners?
- Social engagement rate: Is follower growth translating into real interaction, or just vanity numbers?
- Audience demographics: Which age groups and cities are responding most strongly?
- Cross-artist comparison: How does Artist A’s six-month trajectory compare to Artist B’s at the same career stage?
That last point matters more than most managers realize. Side-by-side comparison lets you allocate budgets based on evidence rather than favoritism or recency bias.
| Metric | What it tells you |
|---|---|
| Monthly listener growth rate | Whether a release created lasting momentum or a one-week spike |
| Playlist add velocity | How quickly the algorithm is picking up a track |
| Audience city concentration | Where touring demand is actually building |
| Social follower-to-engagement ratio | Whether an audience is genuinely invested or passively following |
Pro Tip: Set a fixed reporting day each week. Reviewing data on the same day every week makes trend lines visible that you would completely miss if you only check after a release or a pitch.
What cross-platform analytics dashboards offer that single tools cannot
Spotify for Artists tells you what is happening on Spotify. That is useful, but it is incomplete. A track gaining traction on TikTok before it charts on Spotify is a signal you will miss entirely if you only watch one platform.
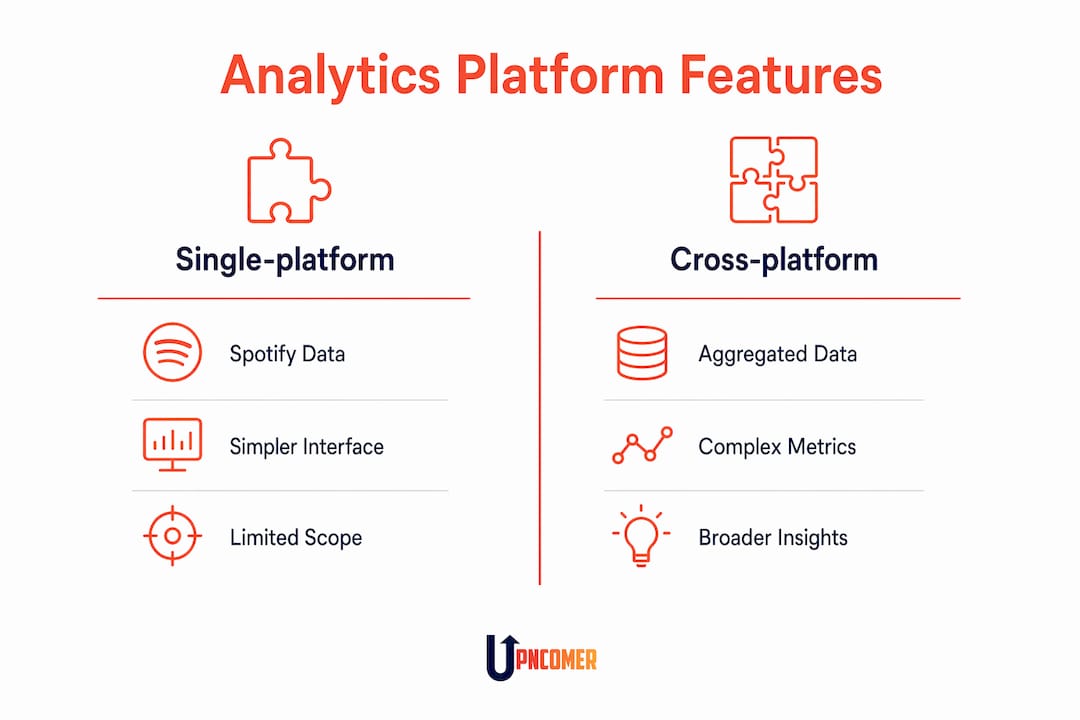
Cross-platform tools like Chartmetric aggregate data from dozens of services, giving you a comprehensive view of artist momentum that no single-platform dashboard can match. Chartmetric’s Artist Plan starts at $60 per year, which is a low cost relative to the strategic advantage it provides. For managers handling multiple artists, that price point is essentially negligible compared to a single misinformed booking or campaign decision.
The tradeoff is real, though. More data means more complexity. Managers who jump into a cross-platform tool without a clear reporting structure often end up drowning in metrics that do not connect to decisions. The solution is to identify three to five core metrics per artist and filter everything else out until those are mastered.
Here is how single-platform and cross-platform tools compare on the metrics that matter most to managers:
| Feature | Single-platform (e.g., Spotify for Artists) | Cross-platform (e.g., Chartmetric) |
|---|---|---|
| Streaming data depth | High | Medium to high |
| Social media tracking | None | TikTok, Instagram, YouTube, X |
| Playlist history | Limited | Full history across platforms |
| Artist Score / benchmarking | No | Yes |
| Audience overlap analysis | No | Yes |
| Competitive intelligence | No | Yes |
| Cost | Free | From $60/year |
Chartmetric’s infrastructure processes billions of rows of data to deliver real-time dashboard updates. That speed matters because trends in music move fast. A track that is gaining momentum on a Tuesday can peak by Friday, and if your data is three days old, you have already missed the window to amplify it.
You can also use cross-platform tools to track music events and correlate live activity with streaming and follower growth, which is especially useful when planning a tour around genuine demand rather than assumptions.
How do analytics platforms help managers discover emerging talent?
Scouting used to mean attending shows, reading blogs, and relying on word of mouth. That process still has value, but it is slow and geographically limited. Analytics platforms have changed the discovery process by making momentum visible before it becomes obvious.
Structured metrics like Artist Score, Career Stage, and Growth rates identify genuine momentum in developing artists before they appear on mainstream radar. Filters for genre, geography, and platform engagement reduce the manual research that used to take days into a process that takes minutes. This is not about replacing taste. It is about directing your attention more efficiently.
A practical scouting workflow using analytics looks like this:
- Set your filters. Choose genre, career stage (emerging vs. developing), and geographic region. Narrow to artists with consistent month-over-month growth rather than one viral spike.
- Check the Artist Score trend. A rising score over 90 days signals sustained momentum, not a fluke.
- Look at trigger cities. Geographic data shows which cities are driving early adoption. An artist blowing up in Austin or Atlanta before national attention is a strong early signal.
- Review playlist history. Consistent editorial playlist placements indicate industry tastemakers are paying attention.
- Cross-reference social engagement. High streaming growth paired with strong TikTok engagement suggests an artist with real fan connection, not just algorithmic luck.
Pro Tip: Pair your analytics filters with editorial sources like music blogs and playlist curators. The synergy of editorial curation and analytics data creates a balanced discovery process that blends numerical evidence with human taste. Neither alone is as reliable as both together.
How analytics platforms improve tour planning and release strategies
Tour routing based on gut feeling is expensive. Booking a city because it feels right, only to play to a half-empty room, is a mistake that data can prevent almost entirely.
Audience signals identifying cities gaining momentum give managers a clear picture of where demand is actually building before a single ticket goes on sale. Geographic and demographic data from platforms like Chartmetric show not just where an artist’s listeners are, but where they are growing fastest. That is the difference between booking a tour that confirms existing fans and booking one that builds new markets.

The same logic applies to release timing. Watching playlist and social media trends before a drop tells you whether the moment is right or whether you should wait two weeks for a trend cycle to peak. Releasing into a favorable trend window versus a saturated one can meaningfully shift first-week numbers.
Key ways analytics platforms improve tour and release decisions:
- Demand mapping: Identify cities where monthly listeners are growing without a corresponding live history, signaling untapped markets.
- Timing signals: Track when an artist’s social engagement spikes to find the best release windows.
- Post-show feedback loops: Real-time audience data lets you measure whether a show in a new city translated into streaming and follower growth, confirming whether to return.
- Marketing spend allocation: Prioritize ad spend in cities where organic growth is already happening rather than trying to build from zero.
- Release campaign alignment: Use playlist pitch data and editorial calendar timing to align drops with peak curator attention periods.
When you integrate these signals into your release planning process, every campaign becomes a data point that informs the next one. That feedback loop is what separates managers who grow artists systematically from those who hope each release lands.
Key takeaways
Music managers use analytics platforms because data-driven decisions consistently outperform instinct across roster management, talent discovery, tour planning, and release strategy.
| Point | Details |
|---|---|
| Replace gut decisions with data | Platforms consolidate streaming, social, and playlist metrics into unified artist views for consistent decision-making. |
| Cross-platform tools outperform single dashboards | Tools like Chartmetric provide competitive intelligence and audience overlap analysis that Spotify for Artists cannot. |
| Analytics accelerate talent scouting | Filters for Artist Score, Career Stage, and trigger cities surface emerging artists before they become obvious. |
| Tour routing becomes demand-driven | Geographic audience data identifies cities with real momentum before tickets go on sale. |
| Consistent reporting cadence is non-negotiable | Weekly benchmarking prevents strategic decisions based on one-off spikes or memory gaps. |
The honest truth about analytics in daily management
I have seen managers buy into analytics platforms with genuine enthusiasm, then abandon them within three months because the data felt overwhelming. The problem was never the platform. It was the absence of a workflow.
Analytics platforms are most valuable when integrated into daily workflows rather than used sporadically. That sounds obvious, but most managers treat these tools like a reference book they pull out before a big meeting rather than a dashboard they check every morning. The difference in outcomes is significant.
The other mistake I see constantly is chasing every metric. An artist with 50,000 monthly listeners does not need you tracking 30 different data points. Pick the three metrics that directly connect to your current goal, whether that is growing a specific city, landing editorial playlists, or converting social followers into ticket buyers. Everything else is noise until those three are moving in the right direction.
There is also a real risk of letting data override creative judgment. Numbers tell you what happened. They do not always tell you why, and they rarely tell you what should happen next. The best managers I know use analytics to inform their instincts, not replace them. When the data says one thing and your gut says another, that tension is worth sitting with rather than immediately resolving in favor of whichever voice is louder.
The managers getting the most from these tools right now are the ones who have built a reporting cadence, assigned meaning to a focused set of metrics, and treat the music manager data insights as a conversation starter rather than a final answer.
— Karan
How UpNComer helps music managers work smarter with data
If you are managing artists and still piecing together reports from five different platforms, there is a better way to work.
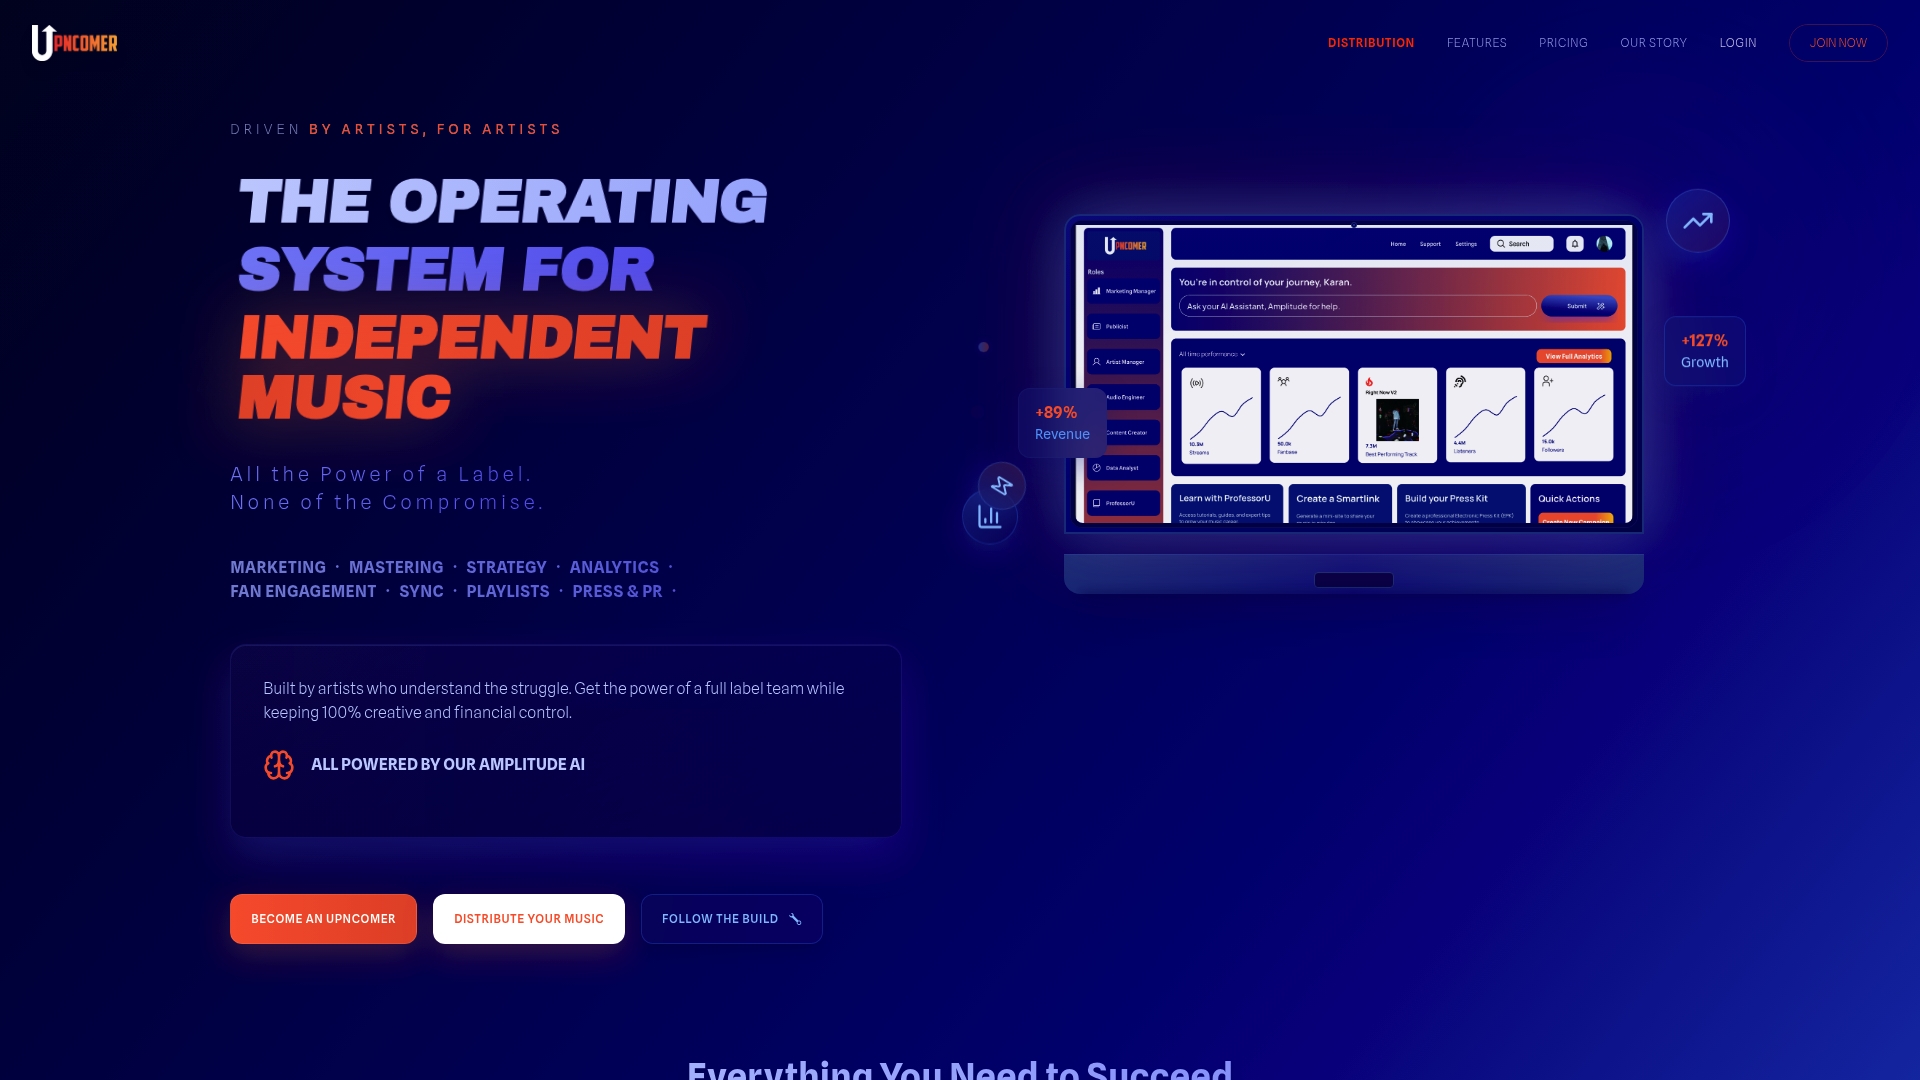
UpNComer brings streaming analytics, audience insights, campaign management, and artist development tools into one place, so you are not losing time switching between tabs to get a complete picture. The Growth Engine and Artist Manager modules give you the kind of real-time performance visibility that used to require a full data team. Amplitude AI adds a layer of intelligent guidance that helps you interpret what the numbers actually mean for your next move. Whether you are planning a release, routing a tour, or evaluating a new signing, UpNComer gives you the infrastructure to make those calls with confidence. Explore what UpNComer offers and see how it fits your management workflow.
FAQ
What are music analytics platforms?
Music analytics platforms are tools that aggregate streaming, social media, playlist, and audience data into unified dashboards, replacing manual data collection with real-time performance monitoring. Examples include Chartmetric, Viberate, and Spotify for Artists.
How do analytics platforms help with music manager decision making?
Analytics platforms replace memory-based and instinct-based decisions with consistent, measurable benchmarks across streaming growth, social engagement, and audience demographics. This clarity directly supports budget allocation, contract negotiation, and campaign adjustments.
What is the difference between Chartmetric and Spotify for Artists?
Spotify for Artists provides deep data only for Spotify, while Chartmetric aggregates data from dozens of platforms including TikTok, YouTube, and Instagram, offering competitive intelligence, playlist history, and Artist Score benchmarking that single-platform tools cannot match.
How do managers use data for tour planning?
Managers analyze geographic audience data to identify cities where monthly listeners are growing fastest, then prioritize those markets for routing. Post-show data confirms whether new cities converted into lasting streaming and follower growth.
How often should music managers review analytics data?
Weekly reporting cadences are the standard for effective roster management, as consistent benchmarking prevents strategic decisions based on one-off spikes or inaccurate recollections of past performance.