Spotify Analytics for Independent Artists: 2026 Guide

Spotify analytics is the data system that tracks how your music performs across streams, audience demographics, and listener engagement on the platform. For independent artists, this data is not a bonus feature. It is the foundation of every smart marketing decision you make. Spotify for Artists gives you direct access to this dashboard, while third-party tools like stats.fm and Soundcharts extend what you can see. Spotify paid out over $11 billion to the music industry in 2025, with roughly half generated by independent artists and labels. That number tells you one thing clearly: the independent music economy is real, and the artists winning inside it are reading their data.
What are the critical Spotify analytics metrics every independent artist should know?
Spotify for Artists tracks several layers of performance data, and not all of them carry equal weight. Understanding which numbers actually matter will save you from chasing the wrong goals.
The core metrics break down like this:
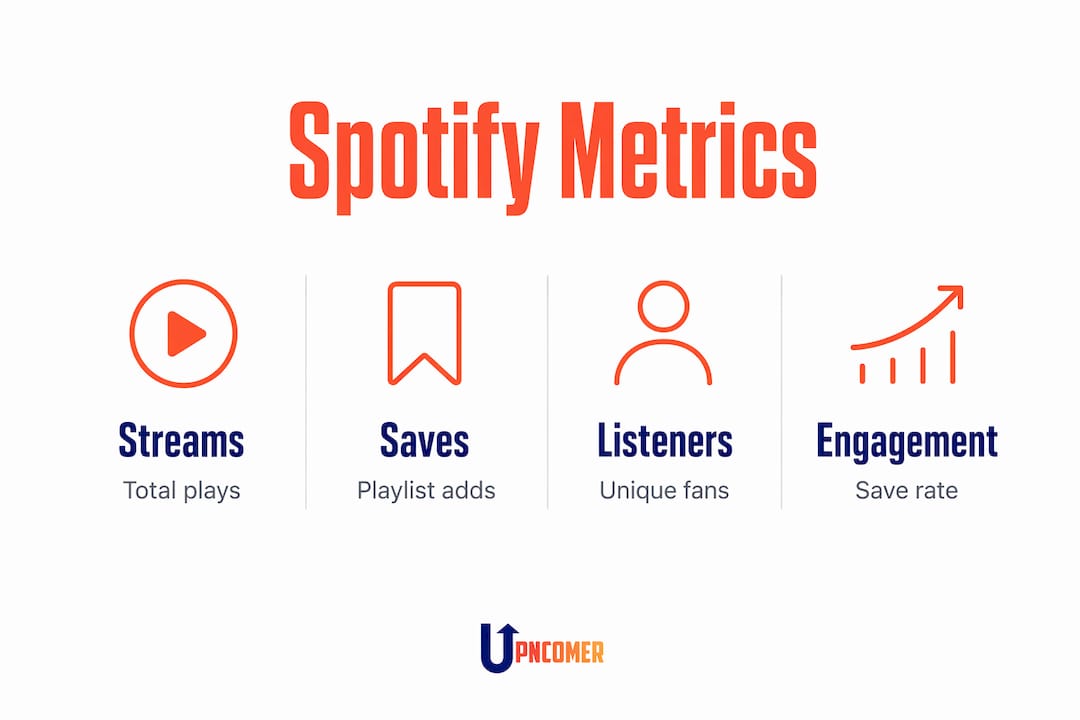
- Streams: The total number of times your tracks have been played. A stream counts after 30 seconds of playback.
- Listeners: The number of unique accounts that played your music in a given period. This is different from streams because one listener can generate multiple streams.
- Saves: When a listener adds your track to their personal library. This is one of the most telling signals of genuine fan interest.
- Follows: Listeners who subscribe to your artist profile to hear future releases.
- Playlist placements: Which playlists are driving your streams, whether editorial, algorithmic, or listener-created.
- Source of streams: Where your plays are coming from, including Spotify’s own algorithmic playlists like Discover Weekly, editorial playlists, artist profiles, and external sources.
- Geographic data: Which cities and countries your listeners are concentrated in.
- Demographic data: Age ranges and gender breakdowns of your audience.
Geographic and demographic data are where most independent artists leave real value on the table. If your listeners are concentrated in three cities, that tells you exactly where to book your next tour leg. It also tells you where to run paid ads and which local press outlets to pitch. This is music audience analytics working at its most practical.
Spotify analytics update every 15 minutes for most performance metrics, though some data points take up to 48 hours to refresh. That delay matters when you are trying to read the momentum of a new release in real time.

Pro Tip: Check your saves-to-streams ratio, not just your total stream count. A track with 5,000 streams and 800 saves is performing better algorithmically than one with 20,000 streams and 200 saves.
How do Spotify analytics influence marketing strategies and audience engagement?
Reading your streaming performance data is one thing. Turning it into a plan is another. Here is a practical framework for using your Spotify data to drive real marketing decisions.
-
Use city concentration data to plan tours. Ten thousand monthly listeners spread evenly across 40 countries is a very different situation from 10,000 listeners concentrated in Chicago, Atlanta, and Houston. The second scenario tells you exactly where to play. Cross-reference your listener cities with ticket sales data to confirm demand before booking venues.
-
Use playlist source data to refine your pitching. If most of your streams come from algorithmic playlists like Radio or Discover Weekly, that signals strong listener-to-listener sharing. If editorial playlists are driving your numbers, your pitch strategy is working. If neither is contributing, you have a clear gap to address.
-
Time your releases around active engagement windows. Look at when your listeners are most active by reviewing weekly stream patterns. Releasing on a friday is standard practice, but your audience data may show a different peak. Some niche genres see stronger engagement mid-week.
-
Cross-reference Spotify data with social and ticket sales. Streaming data alone is insufficient to reveal the full artist-to-fan conversion path. Spotify helped drive $1.5 billion in concert ticket sales by 2025. That connection between streaming and live revenue is real, but you only see it when you stack your data sources together.
-
Target your ad spend by listener geography. If your Spotify data shows strong listener density in a specific metro area, run Instagram or TikTok ads geo-targeted to that city. You are not guessing at your audience. You are confirming what the data already shows you.
Pro Tip: When you pitch to Spotify editorial playlists through Spotify for Artists, submit at least seven days before your release date. Editors need time to review, and late submissions are automatically disqualified.
Successful artist teams interpret Spotify data alongside touring and social signals to filter noise and focus on long-term growth. That combination is where the real competitive edge lives.
What are the limitations and common pitfalls when using Spotify analytics?
Spotify for Artists is a powerful tool, but it has real constraints. Knowing where it falls short protects you from making bad decisions based on incomplete information.
-
Data update delays. Most metrics refresh every 15 minutes, but some take up to 48 hours. This means you cannot make real-time decisions based on live data during a release week. Build a 48-hour buffer into your analysis before drawing conclusions.
-
Monthly listeners is a vanity metric when used alone. A spike in monthly listeners looks exciting, but it tells you nothing about depth of engagement. One viral moment can inflate your monthly listener count for 28 days and then disappear entirely. Always pair monthly listeners with saves and follow rates to understand whether new listeners are converting to fans.
-
The 28-day data window. Spotify limits native data exports to a rolling 28-day window. If you are not manually exporting or using a third-party tool, you lose historical trend data permanently. This makes it nearly impossible to spot seasonal patterns or measure year-over-year growth without external help.
-
No cross-platform visibility. Spotify’s data does not show you what your listeners do on Instagram, YouTube, or at your merch table. You only see one slice of their behavior. Relying on Spotify alone gives you a partial picture of your audience.
-
Save rate predicts algorithmic success better than raw streams. Conversion-focused signals like saves strongly influence Spotify’s algorithmic playlist placements, more so than raw stream numbers or monthly listeners alone. Artists who chase stream counts without monitoring save rates often miss why their algorithmic reach stalls.
Sustainable careers grow from smaller, highly engaged audiences rather than massive stream counts. The 100,000th highest-earning artist on Spotify in 2025 made over $7,300, a 20-fold increase compared to 2015. Depth of engagement, not breadth of reach, drives that kind of income growth.
Which third-party tools complement Spotify analytics for deeper insights?
Spotify for Artists covers the basics well, but it was not built for deep historical analysis or competitive benchmarking. Third-party tools fill those gaps directly.
Tools like stats.fm and Soundcharts offer longitudinal data tracking and competitor benchmarking that Spotify’s native dashboard does not provide. They also recover historical data that Spotify only retains for a limited window, which is critical for building trend analysis over months or years.
| Tool | Core strength | Best for |
|---|---|---|
| Spotify for Artists | Real-time stream and audience data | Day-to-day performance monitoring |
| stats.fm | Personal listening stats and extended history | Tracking your own long-term trends |
| Soundcharts | Cross-platform charting and competitor tracking | Benchmarking against similar artists |
| Upncomer Data Analyst | Integrated streaming and marketing analytics | Full career data in one place |
The practical workflow is straightforward. Use Spotify for Artists as your primary daily dashboard. Export your data weekly before it ages out of the 28-day window. Use stats.fm or Soundcharts to build historical trend lines and spot patterns that a single month of data cannot reveal. Then bring all of it into a unified view with a platform like Upncomer, which connects streaming analytics with marketing tools so you are not switching between five tabs to make one decision.
The intelligence layer of combining Spotify data with other platforms is where successful music careers gain competitive advantage. That is not an abstract idea. It is the difference between knowing you have fans in Nashville and knowing you have 2,400 fans in Nashville who save your tracks at a high rate and follow you on Instagram.
Key takeaways
Spotify analytics gives independent artists the data they need to make real marketing decisions, but only when you read engagement depth, not just stream volume.
| Point | Details |
|---|---|
| Save rate over stream count | Saves predict algorithmic playlist placement more reliably than raw stream numbers. |
| Geographic data drives touring | Listener city concentration tells you where to book shows and focus ad spend. |
| 28-day window requires action | Export data weekly or use stats.fm and Soundcharts to preserve historical trends. |
| Cross-platform context is required | Combine Spotify data with social and ticket sales to see the full fan conversion path. |
| Engaged small audiences outperform | Depth of listener engagement drives long-term income growth more than total monthly listeners. |
What I have learned from watching artists misread their data
Artists get excited about monthly listener spikes. I get it. A big number feels like proof that something is working. But I have seen too many artists book tours based on inflated monthly listener counts, only to play to half-empty rooms in cities where those listeners were never concentrated.
The metric that actually predicts a real fan is the save. When someone saves your track, they are telling Spotify’s algorithm they want to hear it again. That signal feeds Discover Weekly, Release Radar, and Radio playlists. Raw streams do not do that with the same force. If your save rate is low, no amount of playlist pitching will fix the underlying problem.
The other mistake I see constantly is treating Spotify data in isolation. Your streaming numbers tell one story. Your Instagram engagement tells another. Your merch sales and ticket conversions tell a third. Music managers who use analytics platforms know that the real picture only appears when you stack those signals together. An artist with 8,000 monthly listeners who sells out a 200-cap venue every time they tour is building something real. An artist with 80,000 monthly listeners who cannot sell 50 tickets has a conversion problem, and no amount of streaming growth will fix it without addressing the gap.
Use your data as a storytelling tool, not just a report card. When you pitch to a venue, a playlist curator, or a brand, your Spotify data is part of your story. City concentration, save rates, and demographic breakdowns all make that pitch more credible. The numbers are not just for your own planning. They are evidence of your audience’s real behavior.
— Karan
How Upncomer helps you act on your streaming data
Independent artists should not need five separate tools to understand their own audience. Upncomer brings streaming analytics, marketing tools, and AI-powered guidance together in one place, so you spend less time switching tabs and more time making music.
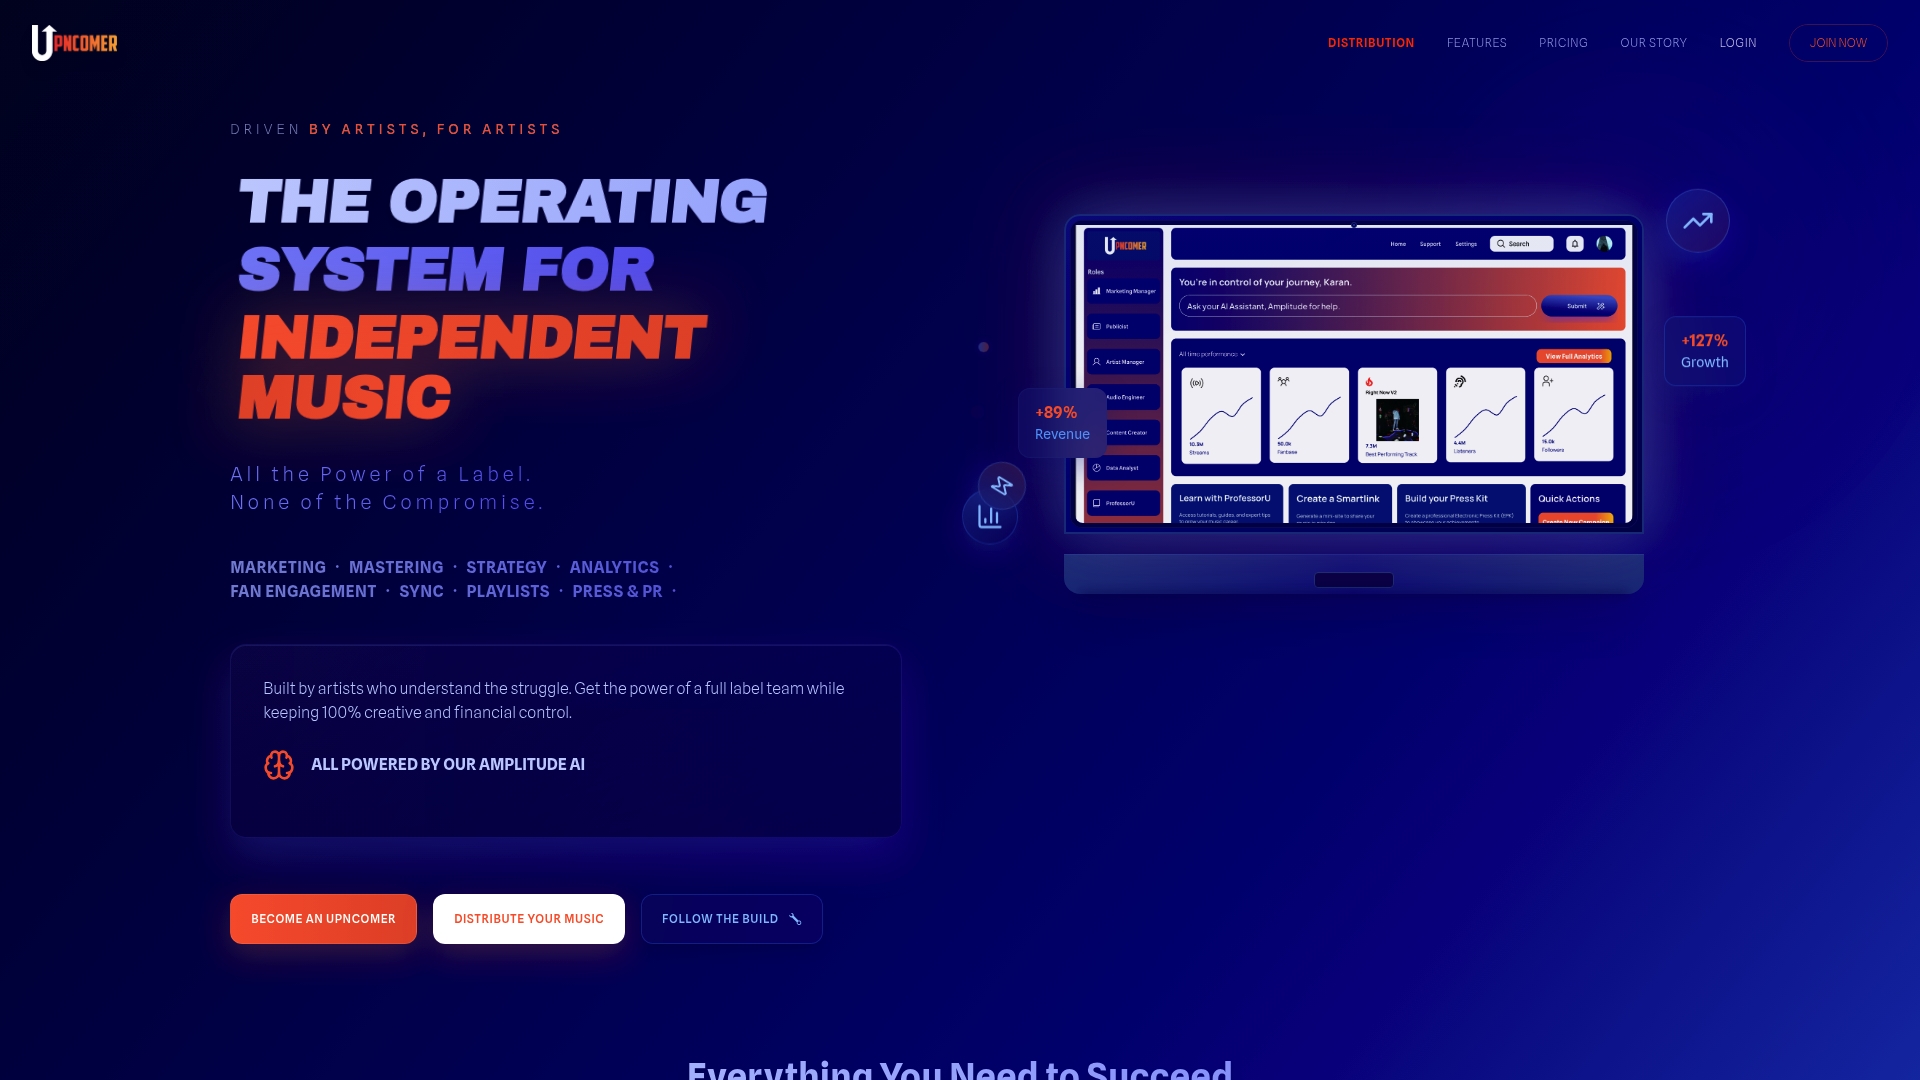
Upncomer’s Data Analyst module connects your Spotify data insights with audience behavior patterns, while the Growth Engine helps you turn those insights into actual campaigns. The Amplitude AI layer gives you guidance on what to do next, not just what the numbers say. Whether you are reading your first release report or planning a full tour strategy, Upncomer gives you the infrastructure to act on your data with confidence. See what Upncomer offers for independent artists ready to build data-driven careers.
FAQ
What is Spotify for Artists?
Spotify for Artists is Spotify’s free dashboard that gives musicians direct access to their streaming performance data, audience demographics, and playlist placement information. Any artist with music on Spotify can claim their profile and access the dashboard.
How often does Spotify analytics data update?
Most Spotify analytics metrics update every 15 minutes, but some data points can take up to 48 hours to refresh. Avoid drawing conclusions from data less than 48 hours old during a new release.
Why is save rate more important than stream count?
Save rate is a stronger signal of genuine fan interest and directly influences Spotify’s algorithmic playlists like Discover Weekly and Release Radar. A high save rate tells the algorithm your music is worth recommending to new listeners.
How do I track Spotify data beyond 28 days?
Spotify for Artists only retains data for a rolling 28-day window. Use third-party tools like stats.fm or Soundcharts to preserve historical trends, or export your data manually each week before it expires.
Can Spotify analytics help me plan a tour?
Yes. The geographic listener data in Spotify for Artists shows you which cities have the highest concentration of your listeners. Cross-referencing that data with ticket sales and social engagement gives you a reliable picture of where live demand actually exists.