Run One Test Per Release: Music Audience Research for Indie Artists
Music audience research is the process of using streaming, social, and direct-fan data, plus targeted surveys, to figure out which listeners will actually convert into paying fans. The first step isn’t building a spreadsheet empire. It’s naming one decision you need to make and testing it against one data source, whether that’s Spotify for Artists, your Instagram insights, or a five-question fan survey.
TL;DR:
- Small differences in listener behavior, such as save and repeat rates, strongly predict fans’ likelihood to buy tickets or merchandise, rather than raw stream counts.
- Conducting targeted tests in specific cities or audience segments with small budgets can yield actionable insights without extensive data science expertise.
- Cross-platform data aggregation platforms like UpNComer streamline research workflows, reducing manual effort and ensuring consistent, reliable insights for decision-making.
- Privacy considerations require collecting only necessary fan data, securing it properly, and transparently informing fans about how their information is used.
- Focusing on proven metrics and a disciplined research cycle is more effective than chasing perfect dashboards or broad, unfocused data collection efforts.
Table of Contents
- What Music Audience Research Actually Helps You Decide
- A Five-Step Research Framework You Can Run Every Release
- Metrics That Actually Predict Fan Value
- Turning Research Into Marketing and Touring Decisions
- How UpNComer Puts This Workflow on Autopilot
- The Privacy Line Every Artist Needs to Respect
- Where Audience Research Is Headed Next
- A Reasonable Take on Chasing Data Perfection
- Try the Workflow Inside One Dashboard
- Sources
- FAQ
What Music Audience Research Actually Helps You Decide
Most artists think audience research means staring at charts until inspiration strikes. It’s the opposite. Good research starts with a decision already on the table: Should you play a show in Denver? Is this single worth a paid campaign? Will merch sell better bundled with vinyl or sold alone?
Audience research generally breaks into three types. Descriptive research tells you who your listeners are (age, city, gender). Behavioral research tells you what they actually do (skip rates, save rates, repeat listens). Attitudinal research tells you what they think and want, usually through surveys or direct conversation.
Common use cases include:
- Deciding which cities deserve a tour stop
- Targeting ad spend toward listeners most likely to convert
- Timing release dates around when your core audience is most active
- Identifying which fans are ready for merch, VIP tickets, or a Patreon-style offer
- Shaping playlist pitching angles around genre and mood data that already resonates
The stakes are real because listening habits are shifting fast; incorporating offline activations and fan contests can enhance engagement as detailed in fan contest engagement benefits for live event fans. IFPI’s global consumer study found time spent on subscription streaming increased significantly worldwide, with short-form video and livestreaming emerging as real discovery channels rather than side shows. If your research plan only looks at raw stream counts, you’re missing where people actually find you.
A Five-Step Research Framework You Can Run Every Release
You don’t need a data science degree. You need a repeatable loop.
- Define the decision and the KPI. Write down the exact call you’re trying to make, like “sell 150 tickets in Austin” or “hit 5,000 saves in the first two weeks.” Vague goals produce vague research.
- Pick your sample and sources. Choose which DSPs, which social window (last 28 days is usually enough), and which fan list you’ll pull from. Don’t try to cover every platform on the first pass.
- Collect the data. Export CSVs from your DSP dashboard, pull social insights, and if needed, send a short survey link through email or Instagram Stories. Strip personal identifiers before storing anything, and only ask for what you’ll actually use.
- Analyze by cohort. Segment listeners by city, age band, or acquisition source, then plot a simple conversion funnel: discovery, first listen, save, repeat listen, ticket or merch purchase. Look for the city or segment with the steepest drop-off.
- Act, then measure again. Run the campaign, book the tour stop, or test the new offer. Compare results against your original KPI, not against a general sense of “it felt good.”
Pro Tip: Run one experiment per release cycle, not five. A single clean test (like comparing ad spend in two cities) gives you a usable answer. Five simultaneous tests just give you five unclear ones.
This loop works whether you’re running it from a single spreadsheet or through a connected platform. The point is consistency, not sophistication. An artist who runs this five-step cycle every release for a year will out-learn one who runs a “perfect” one-time study and never repeats it.
Metrics That Actually Predict Fan Value
Raw stream counts are the most overrated number in the entire industry. A song can rack up streams from algorithmic playlist placement and still have almost no committed audience behind it. Here’s what actually predicts whether someone becomes a paying fan:
- Save rate — a save signals intent to return, which raw plays never do
- Repeat listen rate — fans who come back within a week are far more likely to buy a ticket later
- Listener-to-fan conversion — the share of listeners who follow, save, or engage beyond a single stream
- City-level listener density — useful for tour routing, but only when paired with local ticket price benchmarks and concert history, since streaming density alone can mislead you about a market’s actual spend power
- Playlist-driven listener share — tells you whether your growth is organic or algorithm-dependent
Tool categories that support this kind of tracking include DSP analytics dashboards, unified analytics platforms that merge streaming and revenue data, CRM and ticketing exports, social listening tools, and lightweight survey platforms. Cross-platform comparison matters here too. Isolating performance on one DSP versus another shows you exactly where your marketing is landing and where it’s falling flat.
Reporting cadence matters more than people expect. Spotify updates some figures daily, others weekly. Social platforms often lag 48 hours. Build your analysis calendar around those delays instead of checking obsessively and reacting to noise.
Turning Research Into Marketing and Touring Decisions
Data without a decision rule is just trivia. Set your rules before you look at the numbers, not after, so you’re not tempted to bend the conclusion to fit what you already wanted to do.
Example decision rules:
- Route a tour stop only if a city shows both strong listener density and a history of comparable-genre shows selling above 60% capacity
- Push paid ad spend toward cities where save rate outpaces the national average, not just where raw listener count is highest
- Treat superfans (repeat listeners, merch buyers, email subscribers) differently from casual listeners in every campaign, since a single generic message underperforms for both groups
- Test regional pockets with small $50 to $100 ad budgets before committing a full campaign budget to one market
A/B testing is simpler than it sounds. Run the same release announcement with two different creative angles to two matched audience segments, then compare click-through and save rate after 72 hours. That’s a valid test. Comparing this month’s numbers to a random month last year is not.
Pro Tip: Before acting on any single data point, ask if it holds up across two sources. A city that looks strong in Spotify data but weak in ticket sales history is a flag, not a green light.
The most common pitfall is treating a one-time spike as a trend. A viral TikTok moment can inflate a week’s numbers without indicating anything durable about that audience.
How UpNComer Puts This Workflow on Autopilot
Running this loop manually across five different logins gets tiring fast, which is exactly the gap UpNComer closes. Data Analyst and Amplitude AI pull DSP and social metrics into one view, so cohort analysis doesn’t mean juggling six CSV exports. Growth Engine handles the campaign side, turning your segment data into targeted ad pushes without a separate ad platform login. Distribution keeps your release data flowing into the same dashboard automatically, and Artist Manager helps track which fans are moving from casual listener to ticket buyer over time.
The benefit isn’t just convenience. It’s consistency. Cross-platform aggregation means your city-level listener data and your ticketing numbers finally live in the same place, which is where real research happens.
The Privacy Line Every Artist Needs to Respect
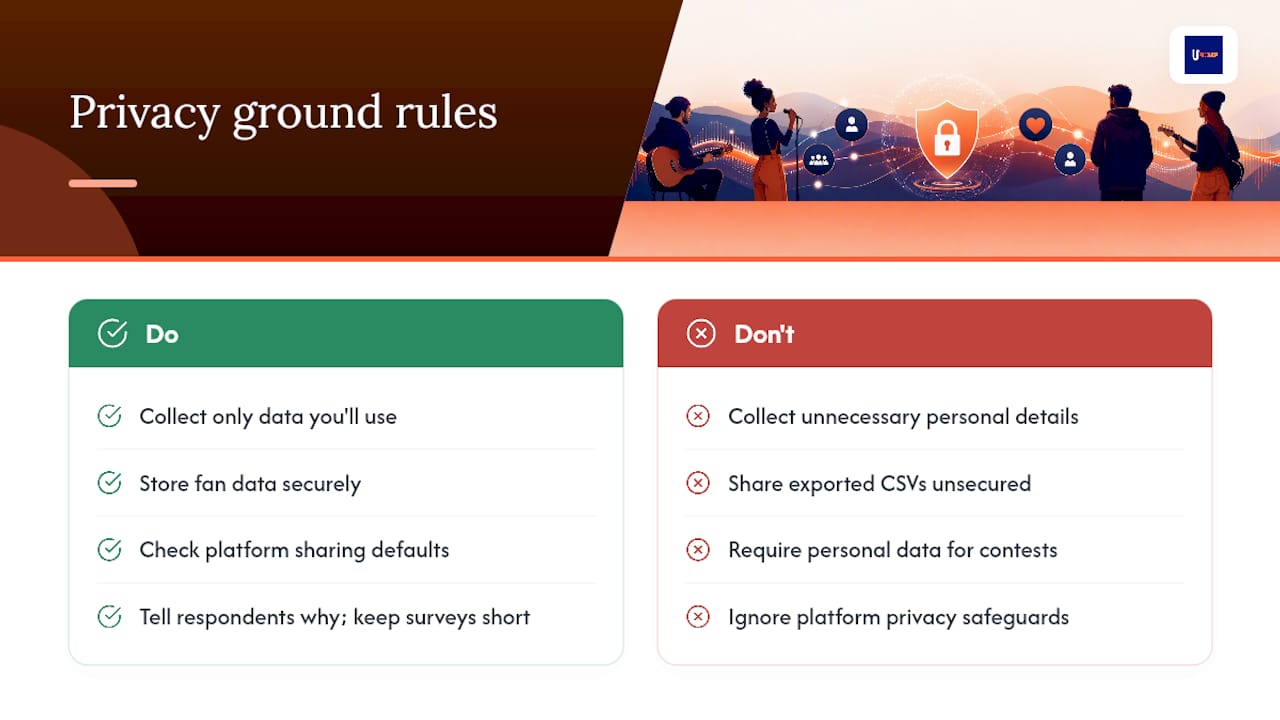
Collecting fan data isn’t automatically ethical just because it’s easy. Email lists, survey responses, and CRM entries contain personal information people gave you in a context they understood, usually “so I can hear about new music,” not “so this gets sold to a third party.”
A few ground rules keep your research defensible. Only collect what you’ll actually use. A survey asking for someone’s income, relationship status, and home address to sell them a t-shirt is collecting more than the decision requires. Store fan data securely and don’t share exported CSVs over unsecured channels. If you’re using a CRM or ticketing platform, check what its default data-sharing settings are, since many opt fans into third-party sharing unless you turn it off.
DSP-level demographic data already has privacy protections baked in. Platforms enforce minimum audience thresholds before showing city or age breakdowns, which is part of why small-catalog artists see blank cells rather than granular numbers. That’s not a bug in your dashboard. It’s a floor designed to keep individual listeners from being identifiable in aggregate data.
Surveys carry the highest ethical weight because you’re asking directly. Tell people what you’re collecting and why, keep the ask short, and never require personal data as a condition of entering a giveaway or contest. Fan trust, once broken over data misuse, is far harder to rebuild than a lost email address ever was.
Where Audience Research Is Headed Next
Short-form video has already reshaped discovery, and that shift is accelerating rather than leveling off. IFPI’s tracking of engagement trends shows short-form clips and in-app experiences becoming standard discovery touchpoints, not novelty channels. Any research plan that ignores TikTok or Reels engagement data is measuring last year’s map.
Generational shift is the other force worth tracking closely. YouGov’s 2026 data shows a majority of Americans who say they’re listening to more music now discover it through streaming service recommendations, with Gen Z disproportionately driving that growth. That means algorithmic discovery has become a main channel for the fastest-growing listener segment, and research methods built around manual playlist tracking alone will increasingly miss where new fans actually come from.
Third-party industry trackers like Luminate’s Music 360 research are also expanding country-level and attitude-based tracking, giving indie teams access to market comparisons that used to require major-label budgets. Expect unified dashboards to keep merging streaming, social, and revenue data into single views, cutting down the manual CSV work that eats up so much of an artist’s research time today. The direction is clear: more automation, more cross-platform blending, and less patience for tools that only show one slice of the picture.
A Reasonable Take on Chasing Data Perfection
Here’s the uncomfortable truth: most independent artists don’t need more data. They need one decision, one test, and the discipline to act on the result. Chasing a flawless dashboard before your first release is a stall tactic dressed up as diligence.
Start with a single CSV export and a real question. Once that habit sticks, scale toward a connected analytics stack that tracks conversion automatically. Prioritize fan-conversion metrics over vanity numbers every time you’re forced to pick.
— Karan
Try the Workflow Inside One Dashboard
Running this five-step framework across six separate logins is exactly the friction that burns artists out before they see results. UpNComer pulls your streaming, social, and fan data into one connected view, so cohort analysis, city-level density checks, and campaign testing happen without exporting a single spreadsheet by hand.
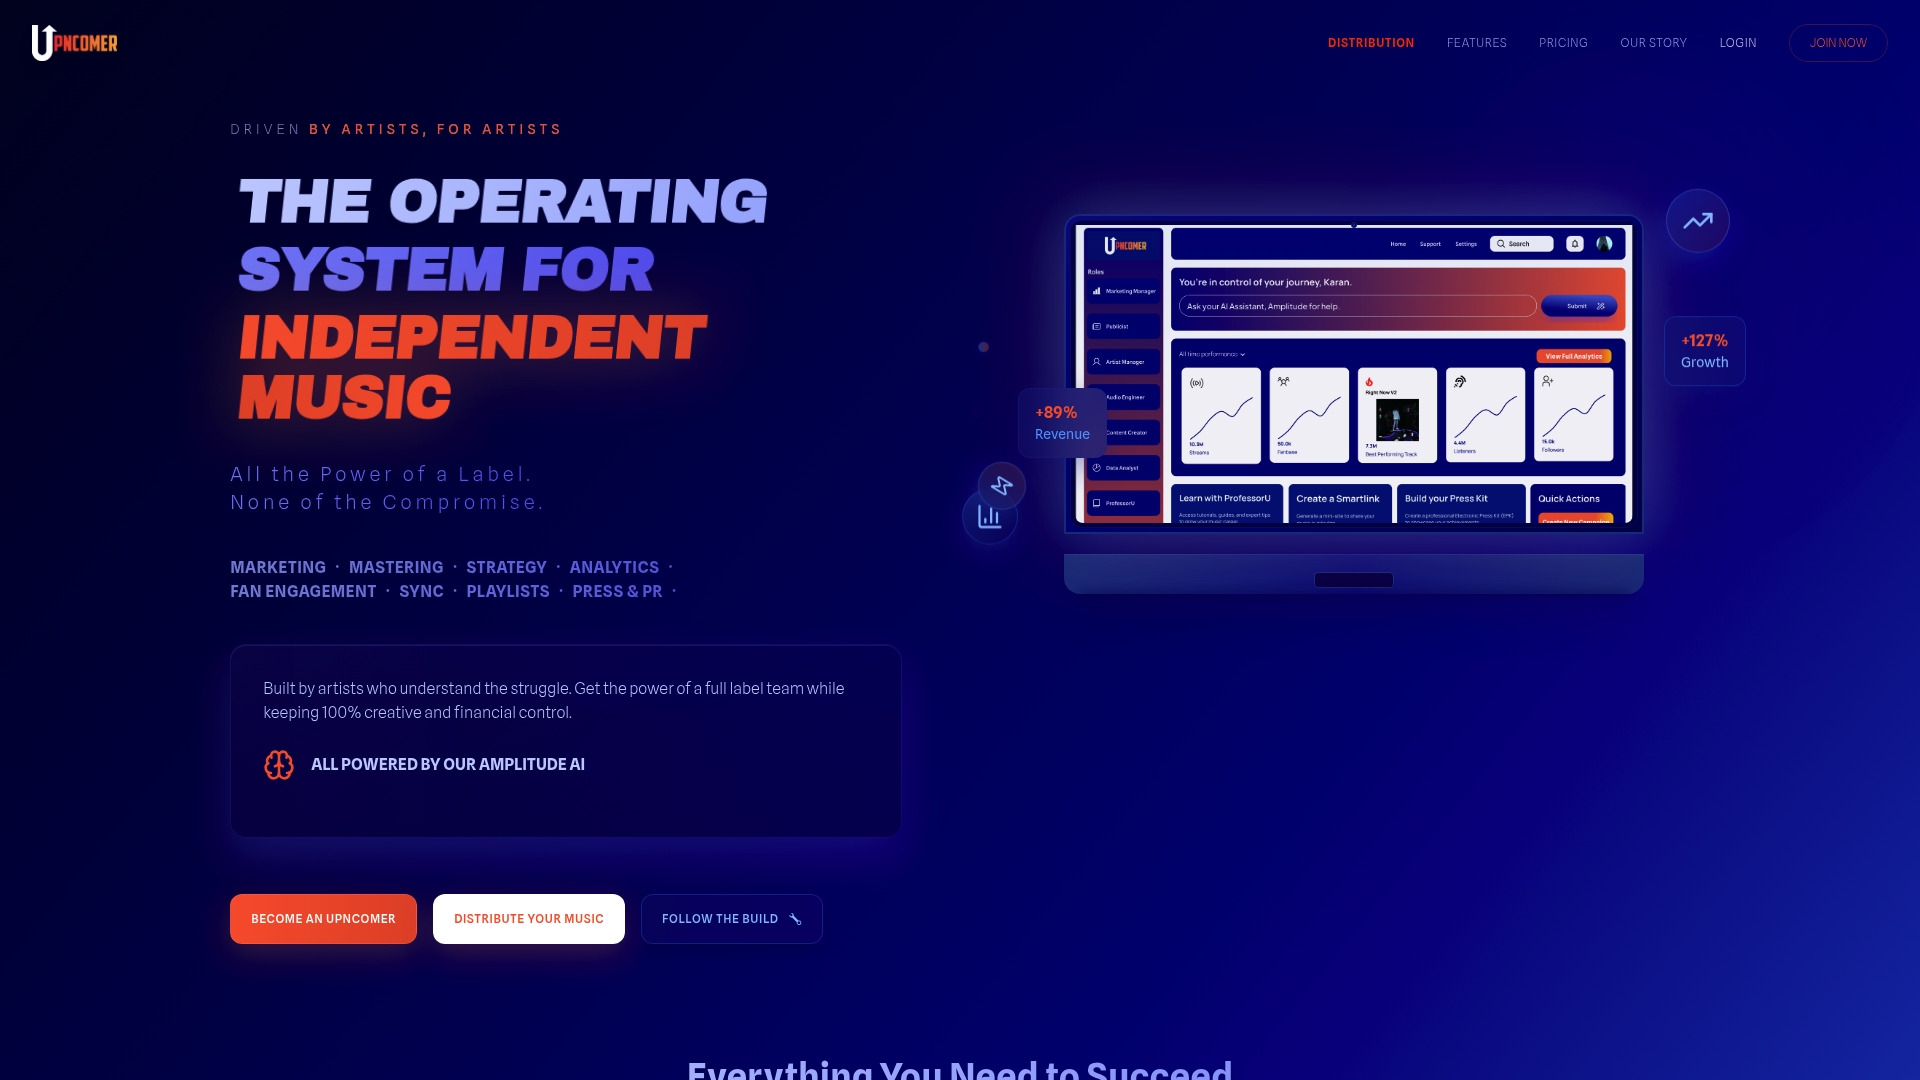
Growth Engine and Data Analyst turn the research steps above into something you actually run every release cycle instead of once a year. Cross-platform aggregation means your distribution numbers and your fan engagement data finally live together, which is where the real decisions get made.
If you’re ready to see how it fits your current release plan, start with the UpNComer platform overview and explore the tools built for exactly this workflow. Want to see what other artists are testing right now? Check the community updates page for fresh workflows and feature releases.
Sources
Every method has a job it’s good at and a job it’s bad at. Mixing them is what separates real audience insights for musicians from guesswork.
DSP analytics (Spotify for Artists, Apple Music for Artists) show you listener counts, save rates, city breakdowns, and playlist sources. Spotify for Artists’ analytics suite breaks audiences into segments and tracks listener conversion, which helps you see where casual streamers turn into repeat fans. The catch: DSP demographic data gets k-anonymized, meaning small artists often see blank cells where a bigger catalog would show numbers. Don’t read an empty box as “no fans there.” Read it as “not enough data yet.”
Social and short-form video metrics (TikTok views, Reels saves, watch-through rate) reveal discovery momentum before it shows up in streams. These numbers move faster than DSP data and often predict a stream spike two to three weeks out.
Direct-fan data from CRM tools, ticketing platforms, and merch stores tells you who’s already paying. This is the highest-value data type because it isn’t inferred, it’s transactional.
Surveys, interviews, and third-party panels fill the gaps analytics can’t. University resources like the Drexel University Libraries Market + Audience Research guide point to demographic and market-profile databases worth pairing with your own DSP exports for a fuller market picture.
Quick reality check: IFPI’s research surveyed 43,000 respondents across 21 countries and found time spent on subscription streaming increased sharply. That kind of scale is why platform-level data still matters even when you’re working with a small catalog.
The shared limitation across all four methods: sampling bias, privacy floors, and reporting lags. A survey of your email list skews toward your most engaged fans, not your average listener. Plan around that instead of ignoring it.
FAQ
Can You Give an Example of Music Audience Research?
A simple example: pulling Spotify for Artists city data alongside your email list signups, then testing a small ad campaign in the top overlapping city to see if it lifts ticket sales. That’s descriptive and behavioral research working together toward one decision.
What Are Good Research Topics for Music?
Strong topics include discovery channel effectiveness (streaming versus short-form video), regional listener density for tour routing, superfan versus casual listener behavior, and the impact of playlist placement on long-term retention.
Who Are the Main Demographics of Music Listeners?
Demographics vary heavily by genre and platform, but YouGov’s 2026 data shows Gen Z accounts for a disproportionate share of the recent increase in listening, driven largely by streaming recommendations and social platforms.
What Are the Big Four in the Music Industry?
The major recorded music companies are Universal Music Group, Sony Music Entertainment, Warner Music Group, and independent labels collectively represented as a fourth force through groups like Merlin, though only the first three are typically called “majors.”
Why Should Independent Artists Bother With Audience Research?
Because guessing which city, campaign, or release date will land is expensive. A data analyst platform turns scattered numbers into one dashboard, cutting the time between a question and a usable answer.