Playlist Conversion Rate: What It Is and How to Track It
Playlist conversion rate measures what happens after someone hears your song on a playlist: do they save it, follow you, stream it again, or buy something? It’s not the same as stream count, and treating the two as interchangeable is why a lot of placements feel like they “didn’t work” when they actually did.
Before you promote a single playlist placement, do this one thing: connect Spotify for Artists and build one smart link with UTM parameters attached. Without it, you’re guessing.
- Save rate tells you if the song resonated
- Stream-to-listener ratio tells you if people are replaying it
- Playlist adds and follower lift tell you if strangers are becoming fans
Tracks that earn saves and repeat plays are 1.4 times more likely to retain listeners after one month than tracks that just rack up passive plays. That’s the whole game: conversion predicts retention, and retention is what actually builds a career.
Key Takeaways
Playlist conversion rate, not raw stream count, determines whether a placement actually builds a lasting audience, and UTM-tagged smart links are the only reliable way to prove which promotion drove it.
| Point | Details |
|---|---|
| Track saves before streams | Save rate of 3 to 5% signals a strong fit for a new artist on a fresh placement. |
| Set up UTMs immediately | Tag every promo channel with a distinct UTM value before your first post goes live. |
| Watch skip rate closely | Keep skip rate under 15%; treat anything above 25% as a metadata or fit problem. |
| Test one variable at a time | Run creative, then CTA wording, then audience segment tests separately over 2 to 4 weeks. |
| Convert clicks into fans | Retarget smart link clickers and email landing page signups after the placement fades. |
Table of Contents
- Playlist Conversion Metrics You Should Be Tracking
- Setting Up Conversion Tracking for a Playlist Campaign
- Tactics That Actually Move Your Save Rate
- Testing and Reading Your Conversion Signals
- The Evidence Behind These Benchmarks
- What I’d Test First With a Fresh Placement
- Sources
- FAQ
Playlist Conversion Metrics You Should Be Tracking
Three numbers matter more than your total stream count, and none of them show up on the front page of your Spotify for Artists dashboard by default. You have to dig for them.
Save rate is saves divided by streams, and it’s the single strongest signal you have. A listener who saves your song is telling Spotify’s algorithm “show me more of this,” which is exactly the kind of engagement that feeds playlist and Radio recommendations. For a new artist without a big following, a save rate of 3 to 5 percent is a solid, realistic benchmark. Anything higher on a fresh placement is a strong sign the song fits its playlist audience.

Stream-to-listener ratio divides total streams by unique listeners. A ratio above 2.0 means the average listener is playing your song more than twice, which is a much better replay signal than raw stream volume alone.
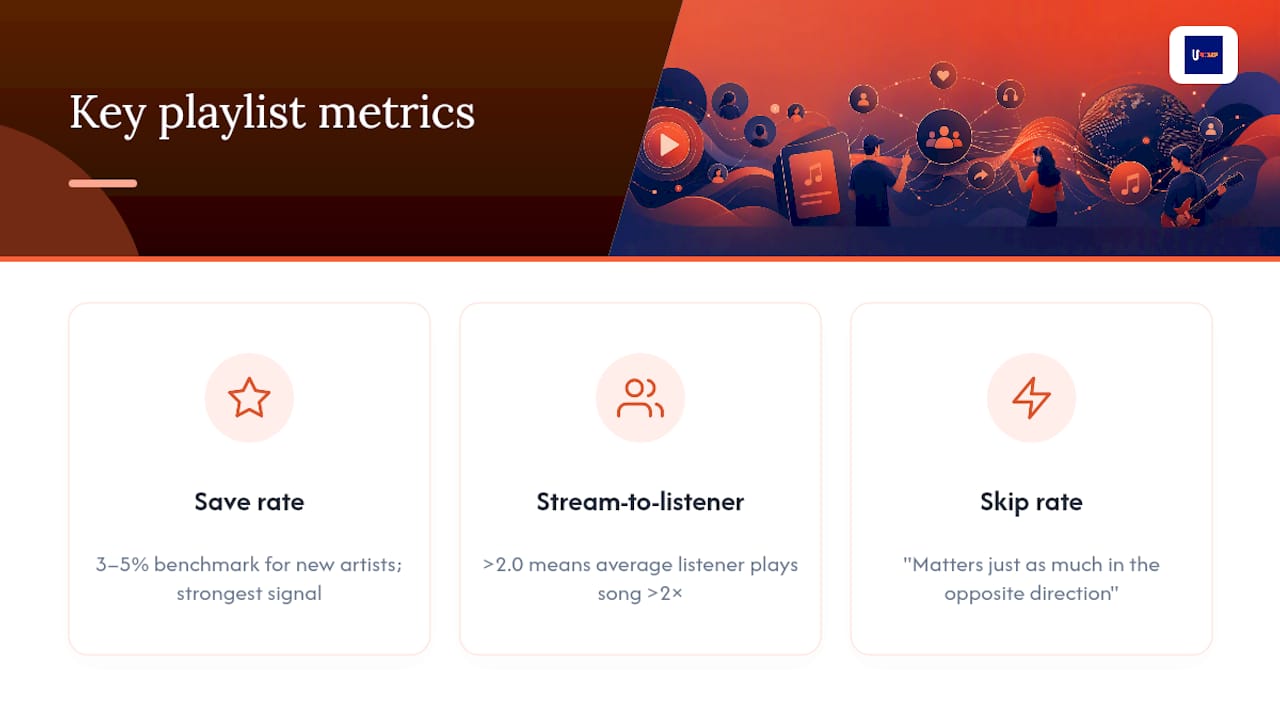
Skip rate matters just as much in the opposite direction.
Round out the picture with playlist adds (are curators and fans re-adding your track to their own playlists?) and follower lift during the campaign window. One catch: Spotify doesn’t always tell you which specific playlist sent a stream spike. That’s where UTM tracking and smart links fill the gap, which is the next problem to solve.
Setting Up Conversion Tracking for a Playlist Campaign
You need three things working together before you promote anything: a data source, an attribution layer, and a landing point. Here’s the setup, in order.
- Open Spotify for Artists and check it on a schedule. Look at saves, listener growth, and playlist adds weekly during a campaign, not just once at launch. A slow build over three weeks looks very different from a spike that fades in two days, and only regular checks catch that.
- Build one smart link for the campaign. Every post, story, and bio link during that push should point to the same URL, tagged with UTMs like
utm_source=playlist,utm_medium=social,utm_campaign=springrelease. This is how you separate traffic from your Instagram story versus your newsletter versus a curator’s own promo post. - Send that link to a focused landing page, not your generic profile. One song, one CTA (play or save), and ideally an email field for people who click but don’t convert immediately.
- Cross-check platform data against your own analytics. Spotify’s dashboard and your smart link clicks should roughly agree. If they don’t, proper campaign tracking helps you catch bot traffic or passive impressions that look like results but aren’t.
Smart links and UTMs exist for exactly this reason. Spotify won’t hand you a clean report saying “this playlist drove 400 saves.” You have to build that report yourself.
Pro Tip: Give every promotional channel its own UTM value, even ones that feel small. A pinned tweet and an Instagram story might both say “utm_medium=social,” but splitting them into “twitter” and “instagram_story” is the only way you’ll know which one actually pulled its weight.
Tactics That Actually Move Your Save Rate
Conversion isn’t luck. It’s a sequence of decisions made before, during, and after the placement goes live.
Before the placement lands:
- Pick the track most likely to convert, not necessarily your favorite. Uptempo, hook-forward songs tend to outperform slow burns on discovery playlists.
- Clean up metadata: correct genre tags, complete songwriter credits, and a real artist bio. Sloppy metadata quietly kills algorithmic pickup.
- Write a tight song story for your pitch. Spotify’s own pitching process explicitly asks for context on the song, and editors use it to decide fit.
- Time your release to avoid dropping the same week as bigger competing releases in your genre.
While the placement is live:
- Post your smart link everywhere, tagged with UTMs, and give each post one job: save, follow, or stream. Don’t ask for three things at once.
- Pin the promo post and use story templates that make saving frictionless (a swipe-up or link sticker beats a caption mention every time).
- Push a 15 to 30 second vertical clip built around the most repeatable hook in the song, since that’s the moment most likely to make someone hit save or replay.
- Time your promo posts around your audience’s peak activity windows, not just whenever you remember to post.
After the placement fades:
- Retarget everyone who clicked your smart link but didn’t convert with a second ad or post.
- Email your landing page signups with a follow-up: a new video, a tour date, or a merch drop.
- Offer a small incentive (a discount code, early ticket access) to turn a casual listener into a paying fan.
Playlist audiences convert differently than ad audiences because they’re already in discovery mode. Coordinated placements across 15 to 25 well-matched playlists commonly generate save rates in the 4 to 10% range, well above what most small paid campaigns produce.
Testing and Reading Your Conversion Signals
Run your first tests on the elements most likely to move the needle, and don’t test everything at once.
- Test creative first. A short vertical video clip against a static audio post, same song, same caption structure.
- Test your CTA wording second. “Save this” versus “Follow for more” can produce noticeably different click behavior.
- Test audience segments third, once creative and copy are settled, not before.
Give any test two to four weeks and don’t trust a trend until you’ve got a meaningful volume of clicks or streams behind it.
Pro Tip: Check daily during the first week for anything alarming (a broken link, a skip rate spike), but make real decisions on weekly and 30 to 90 day windows. Daily numbers are noisy; monthly retention is the truth.
The Evidence Behind These Benchmarks
None of this is guesswork. Spotify’s own campaign kit tells artists to submit unreleased music with a clear song story, which is precisely why pre-placement pitch quality matters as much as the song itself.
The comparative data is just as telling. Playlist traffic tends to outperform paid ads on the metrics that matter long-term:
- Ad campaigns often produce high impressions but save rates of only 1 to 3 percent
- Playlist placement traffic frequently shows save rates of 4 to 8 percent or higher
- Smaller, well-matched playlists often beat huge passive ones on real engagement
A listener discovering you through a playlist is already in a different headspace than someone scrolling past an ad. They’re looking for something new. That’s why the same song can convert at wildly different rates depending on the channel that delivered it.
UpNComer’s Amplitude AI and streaming analytics tools pull these signals together automatically, and Growth Engine connects your smart links, campaign tracking, and pitch workflow so you’re not stitching together spreadsheets by hand. For deeper pitching mechanics, our guide on writing a Spotify editorial pitch walks through the exact story elements editors respond to.
What I’d Test First With a Fresh Placement
If I had two weeks after a new placement went live, I’d run three experiments and nothing else: a vertical hook clip versus a static post, “save this” versus “follow for more” as the CTA, and one retargeting push at day 10 for anyone who clicked but didn’t convert.
Watch clicks and save rate daily for the first week, purely to catch a broken link or an obvious dud. Then switch to weekly reviews for the real read on follower lift and retention. If one experiment clearly outperforms, scale the budget on that single variable before you touch anything else. Adding new variables while scaling is how artists quietly inflate their cost per follower without ever noticing.
— Karan
Sources
- Pitching music to our playlist editors — Spotify for Artists
- Artist
- Playlist Placement vs. Spotify Ads: An Honest Comparison From the People Who Run Both | PlaylistGrow
- URL shorteners for musicians: smart links and pre-saves · Elido
FAQ
What Is a Good Playlist Conversion Rate?
A save rate between 3 and 5% is a reasonable benchmark for a new artist, while established campaigns on well-matched playlists often see 4 to 10 percent.
How Do I Track Which Playlist Sent Me Streams?
Spotify doesn’t expose exact playlist sources, so use a UTM-tagged smart link for every promotional post and cross-check the click data against your Spotify for Artists numbers.
Is Stream Count or Save Rate More Important?
Save rate and stream-to-listener ratio predict long-term retention far better than raw streams, since tracks with strong saves are 1.4 times more likely to retain listeners after a month.
How Long Should I Run a Playlist Promotion Test?
Give any test 2 to 4 weeks and wait for meaningful click or stream volume before drawing conclusions; a handful of streams won’t tell you anything reliable.