
Make Every Stream Count: Multi Touch Attribution for Indie Music Teams

Multi-touch attribution assigns fractional credit to every fan touchpoint, from a playlist ad to a social click to a pre-save, instead of crowning a single moment the winner. Use it when you can actually track listener actions: streams, saves, merch sales, email signups. Pair it with media mix modeling when you’re chasing brand lift or halo effects from audio, because those rarely show up as clean clicks.
TL;DR:
- A data-driven attribution model needs sufficient conversion volume, typically requiring several weeks of consistent tracking before providing reliable insights.
- Combining multi-touch attribution with media mix modeling helps optimize budget shifts and measure brand lift, especially in channels like audio and streaming.
- Match rates in audio campaigns are often low, so tracking platform-native signals and establishing clear downstream KPIs are essential for accurate attribution.
- Using a hybrid approach with short MTA tests and quarterly MMM reviews provides a balanced view of channel contributions and campaign effectiveness.
- Manual setup is complex, but tools like UpNComer streamline the process by integrating campaign management, analytics, and AI-driven insights for small teams and independent artists.
Table of Contents
- What Is Multi-Touch Attribution?
- Common MTA Models and Music-Specific Examples
- MTA vs. Cross-Channel Attribution: When to Use Each
- Where Audio and Streaming Fit in Attribution
- Implement MTA for a Music Campaign: Step-by-Step Checklist
- How UpNComer Helps Music Teams Apply Attribution
- Perspective: Realistic Expectations and Common Pitfalls
- Try UpNComer for Attribution-Ready Campaigns
- FAQ
- Sources
What Is Multi-Touch Attribution?
Multi-touch attribution (MTA) splits credit for a conversion across every touchpoint a fan hit before taking action, with the fractions summing to 1.0 for that single event. That matters for reporting because it stops you from overpaying for the last channel someone touched while ignoring the playlist ad or podcast spot that actually built the interest.

There are two broad styles. Rule-based models assign credit using a fixed formula you choose ahead of time. Data-driven models use machine learning to figure out which touchpoints actually moved the needle, and this approach has become the default in modern platforms as volume and tooling have improved, according to Google’s attribution guidance.
In a measurement stack, MTA sits at the tactical layer, helping you decide where to shift ad spend week to week. Here’s where it typically fits:
- Top layer: brand and halo measurement (media mix modeling)
- Middle layer: multi-touch attribution for channel-level optimization
- Bottom layer: raw event tracking (pixels, Conversion APIs, platform analytics)
Common MTA Models and Music-Specific Examples
Four model types cover most real-world use cases:
- Linear: every touchpoint gets equal credit, useful for a quick baseline read.
- Time decay: touchpoints closer to the conversion get more credit, which fits fast-moving release campaigns.
- Position-based: heavier weight on the first and last touch, lighter weight in between.
- Data-driven: an algorithm calculates credit based on patterns across your actual conversion data.
Picture a fan’s path: they hear your track in a playlist ad, click through to your artist profile, see a retargeted social ad, then tap “pre-save” from an email link.
Pro Tip: Model choice matters most when you’re deciding budget shifts, not when you’re just reporting results, since a linear model can tell a very different story from a data-driven one on the same campaign.
MTA vs. Cross-Channel Attribution: When to Use Each
User-level MTA is strong when you have trackable clicks and conversions tied to individual sessions. It gets shaky with audio, because a lot of listening happens without a click at all. That’s where media mix modeling (MMM) earns its place: it works from aggregated data and captures the halo effect audio often produces, the kind of brand lift that shows up in search volume or direct streams days after a campaign, not in a pixel fire. The IAB’s guidance on measuring digital audio in MMM points out that MMM is built for exactly this kind of low-click, high-impact channel.
A practical hybrid workflow for a small team:
- Run short MTA-driven tests to optimize creative and placement week to week.
- Run a periodic MMM read (quarterly or per release cycle) to judge overall channel contribution.
- Use MTA for tactical budget shifts and MMM for the bigger planning conversation, like how much of your next campaign budget goes to audio versus social.
Where Audio and Streaming Fit in Attribution
Audio and streaming platforms come with real Spotify for Artists Analytics measurement constraints. Privacy rules and limited click behavior mean you won’t get the same granular trail you’d get from a web ad. What you do get are platform-native signals: profile visits, saves, playlist adds, and follower growth, all of which tell you something real about campaign impact even without a traditional click.
Tools that help close the gap include:
- Platform ad analytics, like Spotify’s ad measurement tools, which support pixel and Conversions API tracking plus lift reporting.
- Server-side event tracking, which survives browser privacy restrictions better than old-school pixels alone.
- Identity graphing and first-party data overlays, which can meaningfully raise match rates for audio campaigns.
Map each exposure to a downstream KPI that actually matters to your career: a playlist ad exposure should eventually connect to streams, saves, or follower growth, and a social click should connect to pre-saves or merch purchases. If you can’t draw that line, the metric isn’t worth tracking yet.
Implement MTA for a Music Campaign: Step-by-Step Checklist
Here’s a workflow a small team or solo artist manager can actually run without a data science degree.
- Pick 2 to 3 conversion events that map to your actual goal. For a release campaign, that might be pre-save, first stream, and merch purchase, not ten vague “engagement” metrics.
- Set up tracking infrastructure. Install the relevant ad platform pixel, wire up server-side events or a Conversions API where available, and use stable, consistent event names across every channel so your data doesn’t fragment.
- Connect exposure logs to one central analytics property or warehouse. Check your match rate here, since a low match rate means your attribution numbers are guesses dressed up as data.
- Run a model comparison. Pull last-click numbers next to a data-driven model’s fractional credit and see how differently they rank your channels. This step alone often reveals which touchpoint has been getting undeserved credit.
- Use that comparison to prioritize optimization, shifting budget toward the touchpoints the data-driven model says are actually pulling weight, not just the one closest to the sale.
On timeline and cost: data-driven models need enough conversion volume to stabilize, and Google’s own guidance recommends building up adequate conversion counts before trusting the output. For most independent artists running a single release cycle, that means a few weeks of consistent ad spend and event tracking before the model is worth leaning on. Below that threshold, a simple rule-based model like time decay is more honest than a jumpy data-driven one.
Pro Tip: Don’t switch attribution models mid-campaign. Pick one, run it for the full cycle, then compare, or you’ll be chasing noise instead of signal.
How UpNComer Helps Music Teams Apply Attribution
Running this checklist manually across five different tools is exactly the fragmentation that burns out independent artists before they see a return. UpNComer’s modules map directly onto the steps above:
- Growth Engine manages ad campaigns and placements across channels, keeping event names and tracking consistent.
- Amplitude AI surfaces which touchpoints are actually driving conversions, closer to a data-driven read than a last-click guess.
- Data Analyst centralizes streaming, ad, and audience data so match rates and model comparisons happen in one place.
- Artist Manager and Distribution connect campaign activity to the downstream outcomes that matter: streams, royalties, and fan growth.
A reasonable 30-day experiment: pick one release, track pre-saves, first streams, and one merch or email conversion, then compare last-click versus data-driven credit at the end of the month. Success looks like a clearer picture of which channel actually earns your next ad dollar.
Perspective: Realistic Expectations and Common Pitfalls
Attribution data is never clean, and audio measurement is messier than most. Low match rates, over-reliance on last-touch because it’s simple, and mistaking correlation for causation are the three mistakes that quietly waste the most budget. Recent research on attribution in generative music markets found that noisy signals push decision-making toward blunt, simplified heuristics and away from the kind of precision that actually rewards good campaigns, a pattern that shows up in attribution-aware compensation research and in everyday ad dashboards alike. Run short MTA tests, check them against periodic MMM reads, and keep your identifiers privacy-safe. The goal isn’t a perfect model. It’s a better guess than last click, made consistently.
— Karan
Try UpNComer for Attribution-Ready Campaigns
Setting up pixels, matching conversion events, and comparing attribution models across five different tools is the kind of work that eats a week and burns you out before you’ve learned anything. UpNComer brings campaign management, analytics, and AI-driven insight into one place, so the checklist above becomes a few connected steps instead of a juggling act.
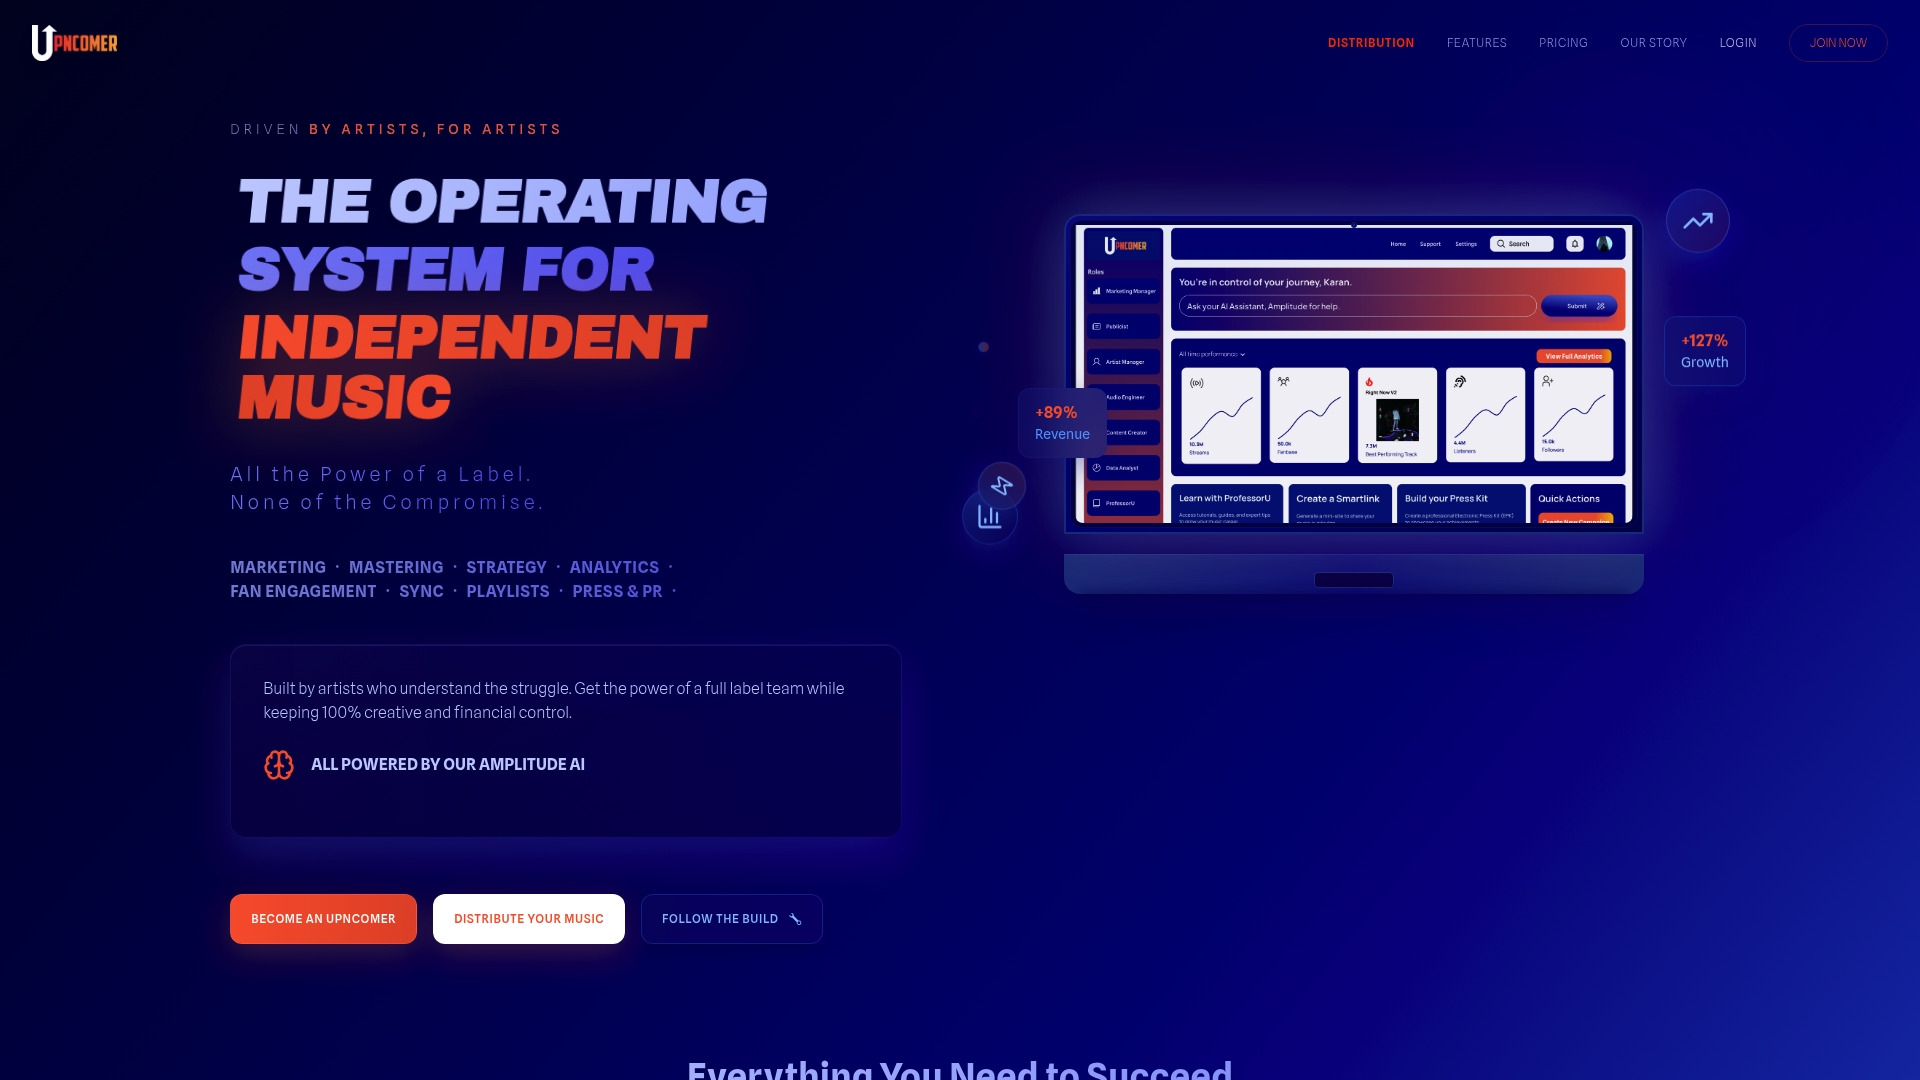
If you’re ready to see how your own campaign data holds up under a data-driven model, UpNComer Pro is $27 per month or $300 per year on the pricing page. Artists who want to connect attribution directly to royalties can also check the distribution page, where UpNComer handles distribution on a royalty split with no separate subscription fee.
FAQ
What does multi-touch attribution mean?
Multi-touch attribution is a measurement approach that splits credit for a conversion, like a stream or a pre-save, across every touchpoint a fan encountered beforehand instead of crediting just one. The fractional credit across touchpoints sums to 1.0 for each conversion event, according to Google’s attribution guidance.
Can you give an example of a multi-touch attribution model?
A time decay model might credit a playlist ad lightly, a social retargeting click more, and the final email tap that led to a pre-save the most, since touchpoints closer to the conversion get heavier weight. A data-driven model would instead calculate those weights from patterns across your actual campaign data rather than a fixed rule.
What’s the difference between last-click and multi-touch attribution?
Last-click attribution gives 100% of the credit to the final touchpoint before a conversion, ignoring everything that built interest earlier. Multi-touch attribution spreads credit across the full path, which tends to give a more honest view of which channels, like playlist ads or podcast spots, actually contributed.
What does first-touch attribution mean?
First-touch attribution gives all the credit to the very first touchpoint a fan encountered, such as the first playlist ad they heard. It’s simple to set up but ignores everything that happened between that first exposure and the eventual conversion, which is why most music marketers use it only as a rough starting point rather than a final read.
Sources
- Google support — data-driven attribution / attribution models
- IAB — Measuring digital audio in MMM (June 2025)
- Spotify Ads — Ad measurement & performance tools
- What’s a credit worth? A market framework for attribution-aware compensation in generative music (arXiv)